Wicomico County Mathematics Content Standards
190 likes | 365 Vues
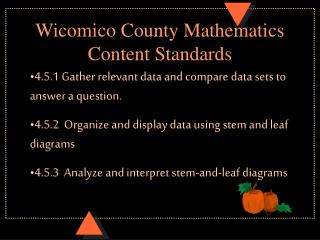
Wicomico County Mathematics Content Standards. 4.5.1 Gather relevant data and compare data sets to answer a question. 4.5.2 Organize and display data using stem and leaf diagrams 4.5.3 Analyze and interpret stem-and-leaf diagrams. Warm-Up. Show this data on a stem-and-leaf diagram.

Wicomico County Mathematics Content Standards
E N D
Presentation Transcript
Wicomico County Mathematics Content Standards • 4.5.1 Gather relevant data and compare data sets to answer a question. • 4.5.2 Organize and display data using stem and leaf diagrams • 4.5.3 Analyze and interpret stem-and-leaf diagrams
Warm-Up Show this data on a stem-and-leaf diagram. Time Spent on Carving Pumpkins • 25 28 32 20 26 • 33 26 19 32 28 20
Time Spent on Carving Pumpkins 1 2 3 9 0 0 0 5 6 6 8 8 2 2 3
Math Journal Write instructions for a fifth grader to follow to make a stem-and-leaf diagram.
Make a stem-and-leaf diagram to show the data on ghost presidents.
Scoring Rubric for the Stem-and-Leaf Diagram • 2 POINTS • All information is accurately included. • Plot is titled. • The plot is neat, well-organized, and attractive. • Leaves are ordered from smallest to largest. • Stems and leaves are accurately displayed. • 1 POINT • At least 3 of the above criteria have been met. • O POINTS • Less than 3 of the above criteria have been met.
Would a line plot be a sensible way to show this data? Explain
How are line plots and stem-and-leaf diagrams alike? How are they different?
Stem-and-Leaf Diagram • The back-to-back stem-and-leaf diagram shows the average daily October temperatures for Spooky City and Candy Corn Village. Use the plot to compare the pattern of October temperatures in the two cities.
Spooky City Candy Corn Village 2 2 9 8 7 7 7 5 3 3 1 1 1 0 8 8 8 7 4 4 2 2 0 0 6 6 4 3 3 0 7 6 5 4 3 1 0 0 0 1 1 1 1 2 3 3 4 5 2 5 5 5 6 6 6 7 8 9 9 2 2 3 4 4 5
What do the digits in the stem represent? • Which leaves, on the right or the left, show temperatures for each city? • Spooky City ___Candy Corn Village ___
The lowest temperature for Spooky City was ___. The highest temperature was ___. For Candy Corn Village, the lowest temperature was ___ and the highest temperature was ___.
How many more days was the temperature in the 60’s and 70’s in Candy Corn Village than in Spooky City?
Writing About Math Write 2 or 3 sentences comparing the temperature patterns for the two cities.
How can you compare the pattern without comparing the actual temperatures?
Homework Write a paragraph or more about stem and leaf diagrams and line plots. Use the notes that you took in class today.