Download
1 / 34
340 likes | 476 Vues
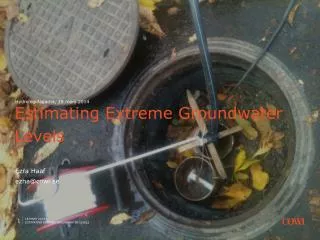
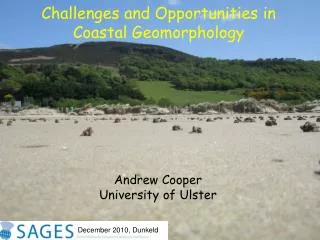
Coastal geomorphology and extreme water levels. COADAPT Project Aart Kroon, Jørn Bjarke Torp Pedersen 26 October 2010. Contents. Introduction Coastal erosion and flooding Extreme water levels Approach Team at DGG-UC.

E N D
Coastal geomorphology and extreme water levels COADAPT Project Aart Kroon, Jørn Bjarke Torp Pedersen 26 October 2010
Department of Geography & Geology Contents • Introduction • Coastal erosion and flooding • Extreme water levels • Approach • Team at DGG-UC
Department of Geography & Geology IntroductionCoastal environments in Denmarklarge spatial variability Geomorphologic map (GEUS, 2009)
Department of Geography & Geology IntroductionTwo major impacts:1. coastal erosion might be intensified;2. coastal flooding might occur more frequent.
Department of Geography & Geology Danish Coastal Authority, 2008 Coastal erosion along the West coast of Jutland well monitored well known ‘under control’
Department of Geography & Geology Coastal erosion along the inner coastlines less monitored less well knownFirst indication by aerial photographs and satellite imageryOn its way!
Department of Geography & Geology Westh, 2009
Department of Geography & Geology Coastal flooding along the coastlines A) potential flooding areas based on digital terrain models (contour maps of the height) - example: ‘Klimatilpasningportal’, DCA B) inundation areas and inundation times based on dynamic models (process-based) - example: DHI
Department of Geography & Geology KMS, 2010 Coastal flooding: spatial patterns
Department of Geography & Geology Example DTM: Glænø, Southern Sjælland
Department of Geography & Geology Example: Havvand på land (seawater at land) Cost-benefit analysis in GIS on DTM Also activities
Department of Geography & Geology Example: Kystplanlæggeren (coastal planner) Also activities
Department of Geography & Geology Coastal flooding DTM + easy to get an indication along all shores + easy to track potential risk areas -- no dynamics, no inundation times -- no distance from breaches included Process model + precise idea of inundation process + precise information about inundation pathways -- relatively time consuming computations -- relatively small spatial coverage
Department of Geography & Geology Coastal flooding Both approaches need to be fed by extreme water level distributions DTM * as exceedence curves of water levels, giving an idea of return periods Process model * as time-series, giving an idea of the intensity and duration of the event
Department of Geography & Geology Summary • Why do we @ DGG need information about extreme water levels? • To understand erosion and accretion patterns along the shores • To understand the risk of flooding in coastal areas • To parameterize extreme events • * spatial patterns around Denmark • * relative importance compared to waves, tides, … • (on its way: AKK) • d) To better understand active beach ridge systems
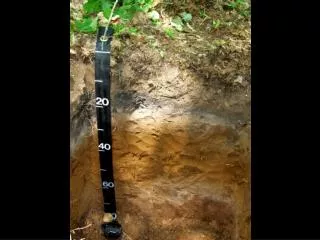
Department of Geography & Geology Extreme water levels and beach ridge systems • Detailed observations of the height of the present day active beach ridge • Coupling of these heights among local water level characteristics: • High-tide level • - Extreme water level with a return period of … (SL1/100x) Beach ridge Glænø
Department of Geography & Geology KMS, 2010 Extreme water levels and beach ridge systems Beach ridge locations
Department of Geography & Geology Description of extreme water levels • Common practice (DCA) • Long data series (years) with frequent observations (every 10 min) • Observed distributions of water heights with special interest in the upper tail • Statistic description of the upper tail with • Truncated Weibull distribution; • Truncated log-normal distribution.
Department of Geography & Geology Description of extreme water levels • Common practice (DCA) • Exceedence curves of water levels at different locations Esbjerg DCA, 2007: Extreme sea level statistics for Denmark
Department of Geography & Geology Use of extreme water level descriptions • Two questions arise: • Can we use existing exceedance curves and return periods to predict flooding events under a rising sea level scenario? • Is the existing analysis method reliable, robust and does it describe the most important features of water levels related to flooding?
Department of Geography & Geology Flooding events under a rising sea level scenario Esbjerg DCA, 2007: Extreme sea level statistics for Denmark
Department of Geography & Geology 25 cm sea-level rise:Return period (yr) for what is now a 100 yr event
Department of Geography & Geology Flooding events under a rising sea level scenario • This will result in higher return periods, but (!!) • Extreme values have another distribution than the bulk of the water levels. Previous extremes are no longer extreme values and need to be described by other functions. • Is it a valid assumption that a rising sea level will not lead to another character of the basin? (is the rest stationary?) • …
Department of Geography & Geology Existing analysis method reliable, robust Reliable yes, but there is a lot of tuning: Distribution parameters are fitted and the truncation level for the truncated distribution is fitted. Especially the latter is extremely sensible and determines the outcome! One distribution type for all data series is preferred. Physical variable is the same and spatial comparison of outcomes is not hindered by the method.
Department of Geography & Geology Are the most important features included? Water level statistics is based on very detailed high-quality long-term series Both types of flooding analysis (DTM and inundation models) will probably need other information as well: Water levels: intensity, duration, frequency of occurrence, sequence (similar to erosion due to storm events or flooding due to intense rainfall events)
Department of Geography & Geology Approach Description of water level: peak-over-threshold / duration curve Statistics of extreme water levels using GEV (Generalized extreme value) distribution creating water-level/duration frequency plots
Department of Geography & Geology Esbjerg 1890-2000
Department of Geography & Geology Esbjerg 1962-2004
Department of Geography & Geology Peak-over-threshold detection Esbjerg 1990-1994
Department of Geography & Geology Sequence analysis Esbjerg 1990-1994
Department of Geography & Geology Relation between intensity and duration Probably not linear Certainly not the same at all locations (shoreline with tides react different, often restrictive to the duration of the high-water event)
Department of Geography & Geology Esbjerg 1990-1994
Department of Geography & Geology Summary - work in progress Mapping accretion-erosion based on aerial photographs Helping with flood mapping procedures using KMS DTM Detailed analysis of present day behavior in some specific areas (with master students) Detailed analysis of beach ridge systems (with master student) Parameterization of coastal processes (with AKK) Detailed analysis of extreme value statistics coupled to water levels
Department of Geography & Geology Since last meeting PhD Alina Kabuth started on 15-07-2010 Parameterization of coastal processes MSc Mette Bendixen Beach ridges and water levels in Denmark Bertram Hacke ICZM and Danish Municipalities Presentations SUSCOD in Sorø Geoforum in Copenhagen