Download
1 / 29
300 likes | 321 Vues
Explore how neoclassical economics views land in production processes, uncovering issues in the price mechanism due to the unique nature of land. Discover why land is not always available for private investment and how communities allocate land for various purposes. Delve into the implications of the scarcity of usable land and its impact on economic development and pricing dynamics.

E N D
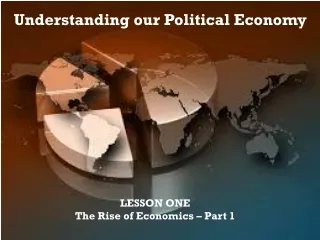
Understanding our Political Economy LESSON FOURTEEN Neoclassical Economic Theory Holes in the Price Mechanism
LABOR Demand curve P R I C E Supply curve e QUANTITY
CAPITAL GOODS Demand curve Supply curve P R I C E e QUANTITY
CREDIT MARKETS Demand curve Supply curve P R I C E e QUANTITY
THE PRICE MECHANISM DOES NOT OPERATE WHERE LAND (I.E., NATURE) IS THE FACTOR OF PRODUCTION
“Land is capital merely; defined in any realistic way, it presents an infinite variety of conditions as to maintenance and replacement requirements, and possibilities of increase in supply, as does any other general class of capital instruments.” Frank H. Knight, On the History and Method of Economics, 1956, p.54.
NOT ALL LAND IS AVAILABLE FOR USE IN THE PRODUCTION OF GOODS (I.E., OF WEALTH) S3 S2 S1 S4 S5 S1 = Total supply of land in a region without regard to topographic, other natural characteristics and societal organization P R I C E S5 S1 S4 S3 S2 QUANTITY
ANOTHER 10-15% OF THE TOTAL SUPPLY OF LAND IS NOT AVAILABLE FOR ADDITIONAL REASONS S4 S3 S2 S1 S5 S2 = Total supply, less land that cannot be productively utilized for reasons of topography, being subject to frequent flooding, potential for earthquakes, etc. etc. P R I C E S5 S1 S4 S3 S2 ..…….. QUANTITY
COMMUNITIES THEN MAKE CONSCIOUS DECISIONS TO SET ASIDE ADDITIONAL LAND S3 S2 S1 S4 S5 S3 = S2, less land allocated for parks, recreation, animal preserves, wetlands, etc. P R I C E S5 S1 S4 S3 S2 ……………… QUANTITY
PUBLIC GOODS AND SERVICES COMMAND ADDITIONAL LAND WITHIN A COMMUNITY S3 S2 S1 S4 S5 S4 = S3, less land allocated for governmental buildings and other public purposes, airports, highways, railway lines, etc. P R I C E S5 S1 S4 S3 S2 …………………….. QUANTITY
THE NET RESULT IS THAT, ON AVERAGE, PERHAPS ONE-HALF OF THE TOTAL LAND AREA IS AVAILABLE FOR PRIVATE INVESTMENT AND DEVELOPMENT S3 S2 S1 S4 S5 S4 = land area actually available for development WHY DOES THIS SUPPLY CURVE S5 LEAN TO THE LEFT AS PRICES ARE RISING? P R I C E S5 S1 S4 S3 S2 QUANTITY
“All markets are speculative and, in fact, approach the character of an ideal market more or less in proportion to the degree that they are explicitly and effectively speculative, i.e., to the degree in which there is organized speculation.”.”