Download
1 / 46
460 likes | 674 Vues
New Products and Services at the Storm Prediction Center. Dr. Russell S. Schneider Dr. Joseph T. Schaefer Dr. David R. Bright Steven J. Weiss Andy R. Dean DOC/NOAA/NWS/NCEP Storm Prediction Center. BASC - June 2008. “Where America’s Weather and Climate Services Begin”. Outline.

E N D
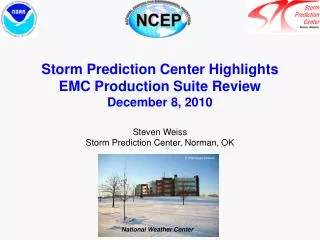
New Products and Services at the Storm Prediction Center Dr. Russell S. Schneider Dr. Joseph T. Schaefer Dr. David R. Bright Steven J. Weiss Andy R. Dean DOC/NOAA/NWS/NCEP Storm Prediction Center BASC - June 2008 “Where America’s Weather and Climate Services Begin”
Outline • Forecast Service Advances • Severe weather outlooks through Day 8 • Probabilistic hazard forecasts • Individual hazard probabilities (Day 1 & Watches) • forecast for (extreme) tornado, hail, wind • Science Infusion & Collaboration • Specialized mission specific software and data • Hazardous Weather Testbed • Early integration of ensemble forecast systems • Storm-resolving WRF NWP • Storm-scale Ensemble Forecast System
“The Storm Prediction Center exists solely to protect the life and property of the American people through the issuance of timely, accurate watch and forecast products dealing with tornadoes and other hazardous mesoscale weather phenomena.”
Severe Weather Outlooks Day 4-8 Outlook Operational since March 2007
Severe Weather OutlooksExploit ensembles to produce probabilistic information through Day 8 Day 6 First Outlook Day 7 Day 8 Day 6 Day 4-8 Outlook Operational since March 2007
“Super Tuesday” Outbreak5 February 2008 56 Fatalities - 15th Largest Death Toll since 1950
Day 4-8 Convective Outlook Operational since March 2007 30% Probability of an Event within 25 mi of a point (“high end” Slight Risk) “Potential too Low” <30 % Probability “Predictability too Low” Widespread severe weather possible, but too much uncertainty to forecast an area Graphic & Short Discussion Issued at 2:30 am Central
Day 3 & Day 2 Convective Outlook Operational since: 2001 & 1986 (categorical); 2001 & 2000 (probabilistic) Probability of Severe Weather within 25 miles of a point Hatched Area --- 10% or greater chance of an extreme event (EF2 or greater tornado, 2” or larger hail, 65 kt or faster gust) DAY AFTER TOMORROW TOMORROW Issued at 2:30 am Central Issued at 1:00 am Central & updated at 1730 UTC Graphic & Discussion Valid for 24 hour period 1200 UTC – 1200 UTC
Day 1 Convective Outlook Operational since 1955 (catagorical) & 2000 (probabilistic) Probability of individual hazards within 25 miles of a point Hatched Areas --- 10% or greater chance of an extreme event (F2 or greater tornado, 2” or larger hail, 65 kt or faster gust) Categorical Risk Tornado Probability Hail Probability Wind Probability Issued at 0600 UTC; updated at 1300, 1630, 2000, 0100 UTC Valid for period ending at 1200 UTC
Verification of Probabilistic OutlooksTornado (2006: Initial Day 1) Significant tornado forecast (hatched area)
Verification of Probabilistic OutlooksHail (2006 - Initial Day 1) Significant hail forecast (hatched area)
Watch Hazard ProbabilitiesAll watches are not created equal Use the probabilities to refine the specific threat within the watch and gauge forecaster confidence in the specific convective hazards Operational since 2006
Verification of Watch ProbabilitiesOne or More Significant Tornadoes (EF2-EF5) > EF2 First Guess for Forecast is Based on Hazard Climatology
SPC Watch Verificationfor Significant Tornadoes (EF2-EF5) 2006: POD > 94% Percent of Extreme Tornado Events in a Watch Percent of Extreme Tornadoes in a Tornado Watch Percent of Extreme Tornadoes
Science Infusion & Collaboration
National Weather Center Co-location !!! SPC WFO Norman NSSL WDTB CIMMS OU School of Meteorology CAPS, OCS Private Sector (nearby)
SPC Personnel Distribution(33 Government, 4 Contract, 2 Students) • Science Support Branch • 1 Branch Chief • 1 Science & Operations (SOO) • 3 Science & Tech. Infusion • 1 Contract Met. Programmer • 1 ESA • 1 Software Analyst • 1 System Administrator • 2 Contract Computer Support • 2 SCEP • Administration • 1 Director • 1 WCM (outreach) • 1 Administrative Officer • 1 Contract Admin. Coord. Operations Branch 1 Branch Chief 5 Lead Forecasters 10 Mesoscale/Outlook 5 Assistant Mesoscale Organic Science Infusion Capability
Examples of Organic (day-to-day) Science Infusion Activities
Severe Storm Environment Relational Database • All “final” severe weather reports since 1950 • Environmental estimates from SPC - RUC analysis (2003 - present) • All historic SPC forecast products • Lightning & radar derived data 139,715 reports & 7396 tornadoes
Shear Instability Context Based Verification
Shear Instability Where we must improve … Overall POD: 0.69
EFP EWP Two Main Program Areas… Experimental Forecast Program Experimental Warning Program Prediction of hazardous weather events from a few hours to a week in advance Detection and prediction of hazardous weather events up to several hours in advance NOAA Hazardous Weather Testbed
NOAA Hazardous Weather Test Bed • HWT – Experimental Forecast Program Objectives • Advance the science of weather forecasting and prediction of severe convective weather consistent with NOAA strategic goals • Enhance collaboration between researchers and forecasters on topics of mutual interest through real-time forecasting and evaluation activities during active severe weather • Provide for thorough examination and efficient delivery of scientific advances for SPC and NWS operations Disciplined collaboration to advance forecast operations
HWT Contributions to Advances in SPC Operations • Short Range Ensemble Forecast System (SREF) • SREF Workshop (NCEP 1994) • Collaboration on SREF with EMC & NSSL (1999-2002) • SPC focused SREF guidance in Operations (2003) • Developing additional calibrated high impact wx. guidance • Global Ensemble Forecast System (GEFS) • SPC Focused GEFS Guidance in Operations (2005) • Working toward NAEFS tools (2009) • Convection Allowing High Resolution NWP • Experimental WRF data in Operations (2004) • Operational WRF data in Operations (2008)
Severe Event of April 7, 2006 • SREF environmental guidance increased forecaster confidence leading to a “High Risk” Day 2 outlook • This was the first Day 2 High Risk ever issued by SPC • Impact: More than 800 total severe reports • 3 killer tornadoes and 10 deaths
SREF Combined or Joint Probability Probability of convection in high CAPE, high shear environment (favorable for supercells) Pr [MUCAPE > 2000 J/kg] X Pr [ESHR > 40 kts] X Pr [C03I > 0.01”]
Calibrated Products at SPC • Use large-scale environmental forecasts to calibrate (i.e., statistically post-process) the ensemble and downscale to the phenomena of interest • Probability of Thunderstorms (CG Lightning) • Probability of Severe Thunderstorms (Reports) • Probability of Dry Thunderstorms (Lightning & RH) • Probability of Snowfall accumulation (MADIS)
Calibrated Probability of a Thunderstorm 3 hr valid period: 21 UTC 31 Aug to 00 UTC 01 Sept 2004 15h Forecast Ending: 00 UTC 01 Sept 2004 Calibrated probability: Solid/Filled
Calibrated Probability of a Thunderstorm 3 hr valid period: 21 UTC 31 Aug to 00 UTC 01 Sept 2004 15h Forecast Ending: 00 UTC 01 Sept 2004 Calibrated probability: Solid/Filled; NLDN CG Strikes (Yellow +)
Calibrated Reliability (5 Aug to 5 Nov 2004) Frequency [0%, 5%, …, 100%] Perfect Forecast Perfect Forecast No Skill Climatology No Skill Calibrated Thunder Probability
SREF 6h Calibrated Probability of Snow/Ice Accum Accumulation calibration based on MADIS road surface observations
Wide range of high impact SREF guidance are available at the SPC website http://www.spc.noaa.gov/exper/sref/
WRF 24 hr Reflectivity ForecastsValid 00z 26 May 2005 ARW4 ARW2 NMM4 RADAR 4.5 km WRF-NMM 4 km WRF-ARW Simulated Reflectivity 24-h Fcsts Valid 00 UTC 26 May 2005 2 km WRF-ARW RADAR VERIFICATION
WRF 24 hr Reflectivity ForecastsValid 00z 26 May 2005 ARW4 ARW2 NMM4 RADAR 4.5 km WRF-NMM 4 km WRF-ARW Simulated Reflectivity 24-h Fcsts Valid 00 UTC 26 May 2005 2 km WRF-ARW RADAR VERIFICATION
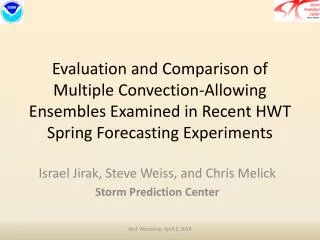
Experimental Storm Scale Ensemble Forecast (SSEF) • NOAA Hazardous Weather Testbed (HWT) • HWT Spring Experiment • Focused on experimental high-res WRF forecasts since 2004 (dx ~2-4 km) • Convection allowing ensemble forecasts (2007-2009) to address uncertainty • 10 WRF members • 4 km grid length over 3/4 CONUS • Major contributions from: SPC, NSSL, OU/CAPS, EMC, NCAR • Evaluate the ability of convection allowing ensembles to predict: • Convective mode (i.e., type of severe wx) • Magnitude of severe type (e.g., peak wind) • Aviation impacts (e.g., convective lines/tops) • QPF/Excessive precipitation • Year 1 Objective (2007): Assess the role of physics vs. initial condition uncertainty at high resolution
Convective Mode: Supercell Detection Besides simulated reflectivity, need a quantitative tool for supercell detection and strength in deterministic and ensemble forecasts 5 km AGL 2 km AGL
Probability Updraft Helicity > 50 m2/s2 Supercell Observed Supercell Forecast (26 hour) Radar BREF 0142 UTC 22 Apr 2008 F026: Valid 02 UTC 22 Apr 2008 Updaft Helicity > 50 m2s-2 within 25 miles
Convective Mode Prediction: Linear • Determine contiguous areas exceeding 35 dbZ • Estimate mean length-to-width ratio of the contiguous area; search for ratios > 5:1 • Flag grid point if the length exceeds: • 50 miles • 100 miles • 200 miles
Probability Linear Mode Exceeding 200 miles Squall Line Prediction F026: Valid 02 UTC 18 Apr 2008 Linear mode + 25 miles
Linear Convective Mode: Impacts Aviation impacts ~ 01 UTC 18 April 2008
Challenges for Severe Weather • Enhance Operations – Research Collaboration • Support Testbed Infrastructure (R2O & O2R) • Staff • Increase Participation through AO Process • Travel Support • Research Support • Reward Effective Collaborators • Operational Meteorologists • Researchers (Government & Academic) • Experimental Data Flows & Workstations • GOES-R Proving Ground • Invest in NOAA Computer Capacity • Harvest Potential of Storm Resolving NWP • Deterministic & Ensemble
NOAA Storm Prediction Center www.spc.noaa.gov