Download

1 / 81
1.28k likes | 2.36k Vues
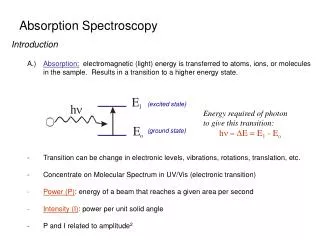
Semester Dec – Apr 2010. INFRARED ABSORPTION SPECTROSCOPY. Learning Outcomes. By the end of this topic, students should be able to: Explain the principles and the working mechanism of infrared (IR) absorption spectroscopy Identify the molecular species that absorb IR radiation

E N D
Semester Dec – Apr 2010 INFRARED ABSORPTION SPECTROSCOPY
Learning Outcomes • By the end of this topic, students should be able to: • Explain the principles and the working mechanism of infrared (IR) absorption spectroscopy • Identify the molecular species that absorb IR radiation • Interpret IR spectrum • Explain stretching and bending vibrations in relation to IR absorption • Determine unknown qualitatively using IR absorption • Draw a schematic diagram of a conventional IR instrument and a fourier transform IR instrument and explain the function of each component of the instrument • Differentiate between a dispersive IR instrument and a FTIR spectrometer
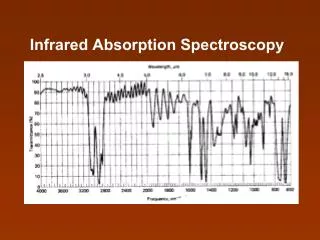
Infrared spectroscopy • Mostly for qualitative analysis • Absorption spectra is recorded as transmittance spectra • Absorption in the infrared region arise from molecular vibrational transitions • Absorption at specific wavelengths • Thus, IR spectra provides more specific qualitative information • IR spectra is called “fingerprints” • - because no other chemical species will have identical IR spectrum
Comparison between transmittance (upper) vs absorbance (lower) plot The transmittance spectra provide better contrast btw intensities of strong and weak bands compared to absorbance spectra
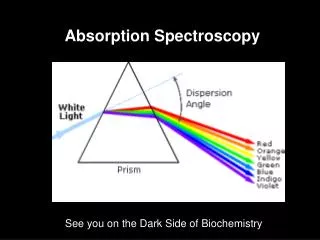
Electromagnetic Spectrum • Energy of IR photon insufficient to cause electronic excitation but can cause vibrational excitation
INTRODUCTION • Comparison between UV-vis and IR • Energy: UV > vis > IR • Frequency: UV > vis > IR • Wavelength: UV < vis < IR
INFRARED SPECTROSCOPY • Infrared (IR) spectroscopy deals with the interaction of infrared radiation with matter • IR spectrum provides: • Important information about its chemical nature and molecular structure • IR applicability: • Analysis of organic materials • Polyatomic inorganic molecules • Organometallic compounds
IR region of EM spectrum: • λ: 780 nm – 1000 μm • Wavenumber: 12,800 – 10cm-1 • IR region subdivided into 3 subregions: 1. Near IR region (Nearest to the visible) - 780 nm to 2.5 μm (12,800 to 4000 cm-1) 2. Mid IR region - 2.5 to 50 μm (4000 – 200 cm-1) 3. Far IR region - 50 to 1000 μm (200 – 10cm-1) visible NEAR MID infrared FAR 8 microwave
When IR absorption occur? 1. IR absorption only occurs when IR radiation interacts with a molecule undergoing a change in dipole moment as it vibrates or rotates. 2. Infrared absorption only occurs when the incoming IR photon has sufficient energy for the transition to the next allowed vibrational state Note: If the 2 rules above are not met, no absorption can occur
What happen when a molecule absorbs infrared radiation? • Absorption of IR radiation corresponds to energy changes on the order of 8 to 40 kJ/mole. - Radiation in this energy range corresponds to stretching and bending vibrational frequencies of the bonds in most covalent molecules. • In the absorption process, those frequencies of IR radiation which match the natural vibrational frequencies of the molecule are absorbed. • The energy absorbed will increase the amplitude of the vibrational motions of the bonds in the molecule.
NOT ALL bonds in a molecule are capable of absorbing IR energy. Only those bonds that have change in dipole moment are capable to absorb IR radiation. • The larger the dipole change, the stronger the intensity of the band in an IR spectrum.
What is a dipole moment? • is a measure of the extent to which a separation exists between the centers of positive and negative charge within a molecule. δ- δ+ δ+
In heteronuclear diatomic molecule, because of the difference in electronegativities of the two atoms, one atom acquires a small positive charge (q+), the other a negative charge (q-). • This molecule is then said to have a dipole moment whose magnitude, μ =qd distance of separation of the charge
Molecular Species That Absorb Infrared Radiation • Compound absorb in IR region Organic compounds, carbon monoxide • Compounds DO NOT absorb in IR region O2, H2, N2, Cl2
Molecular vibration divided into back & forth movement involves change in bond angles stretching bending wagging scissoring symmetrical asymmetrical rocking twisting in-plane vibration out of plane vibration
Sample Handling Techniques • Gases • evacuated cylindrical cells equipped with suitable windows • Liquid • sodium chloride windows • “neat” liquid • Solid • Pellet (KBr) • Mull
LIQUID • a drop of the pure (neat) liquid is squeezed between two rock-salt plates to give a layer that has thickness 0.01mm or less • 2 plates held together by capillary mounted in the beam path What is meant by “neat” liquid? • Neat liquid is a pure liquid that do not contain any solvent or water. • This method is applied when the amount of liquid is small or when a suitable solvent is unavailable
Solid sample preparation • There are three ways to prepare solid sample for IR spectroscopy. • Solid that is soluble in solvent can be dissolved in a solvent, most commonly carbon tetrachloride CCl4. • Solid that is insoluble in CCl4 or any other IR solvents can be prepared either by KBr pellet or mulls.
PELLETING (KBr PELLET) • Mixing the finely ground solid sample with potassium bromide (KBr) and pressing the mixture under high pressure (10,000 – 15,000 psi) in special dye. • KBr pellet can be inserted into a holder in the spectrometer.
MULLS • Formed by grinding 2-5 mg finely powdered sample, presence 1 or 2 drops of a heavy hydrocarbon oil (Nujol) • Mull examined as a film between flat salt plates • This method applied when solid not soluble in an IR transparent solvent, also not convenient pelleted in KBr
What is a mull • A thick paste formed by grinding an insoluble solid with an inert liquid and used for studying spectra of the solid What is Nujol • A trade name for a heavy medicinal liquid paraffin. Extensively used as a mulling agent in spectroscopy
IR Instrument • Dispersive spectrometers • sequential mode • Fourier Transform spectrometers • simultaneous analysis of the full spectra range using inferometry
IR Instrument (Dispersive) • Important components in IR dispersive spectrometer 5 1 2 3 4 signal processor & readout source lamp sample holder λ selector detector Detector: - Thermocouple - Pyroelectric transducer - Thermal transducer Source: - Nernst glower - Globar source - Incandescent wire
Radiation Sources • generate a beam with sufficient power in the λregion of interest to permit ready detection & measurement • provide continuous radiation; made up of all λ’swith the region (continuum source) • stable output for the period needed to measure both P0 and P
Schematic Diagram of a Double Beam Infrared Spectrophotometer
FTIR Why is it developed? • to overcome limitations encountered with the dispersive instruments • especially slow scanning speed; due to individual measurement of molecules/atom • utilize an interferometer
Interferometer • Special instrument which can read IR frequencies simultaneously • faster method than dispersive instrument • interferograms are transformed into frequency spectrums by using mathematical technique called Fourier Transformation FT Calculations interferograms IR spectrum
Components of Fourier Transform Instrument - majority of commercially available Fourier transform infrared instruments are based upon Michelson interferometer 3 4 1 2 5 6
Advantages (over dispersive instrument) • high sensitivity • high resolution • speed of data acquisition ( data for an entire spectrum can be obtained in 1 s or less)
Infrared Spectra • IR spectrum is due to specific structural features, a specific bond, within the molecule, since the vibrational states of individual bonds represent 1 vibrational transition. • e.g. IR spectrum can tell the molecule has an O-H bond or a C=O or an aromatic ring
How to analyze IR spectra • Begin by looking in the region from 4000-1300. • Look at the C–H stretching bands around 3000:
2. Look for a carbonyl in the region 1760-1690. If there is such a band: (also check the exact position of the carbonyl band for clues as to the type of carbonyl compound it is)
3. Look for a broad O–H band in the region 3500-3200 cm-1. If there is such a band: 4. Look for a single or double sharp N–H band in the region 3400-3250 cm-1. If there is such a band:
How to analyze IR spectra • If there is an absence of major functional group bands in the region 4000-1300 cm-1 (other than C–H stretches), the compound is probably a strict hydrocarbon. • Also check the region from 900-650 cm-1. Aromatics, alkyl halides, carboxylic acids, amines, and amides show moderate or strong absorption bands (bending vibrations) in this region. • As a beginning student, you should not try to assign or interpret every peak in the spectrum.Concentrate on learning the major bands and recognizing their presence and absence in any given spectrum.
C-H Stretch for sp3 C-H around 3000 – 2840 cm-1. CH2 Methylene groups have a characteristic bending absorption at approx 1465 cm-1 CH3Methyl groups have a characteristic bending absorption at approx 1375 cm-1 CH2The bending (rocking)motion associated with four or more CH2 groups in an open chain occurs at about 720 cm-1
ALKENE =C-H Stretch for sp2 C-H occurs at values greater than 3000 cm-1. =C-H out-of-plane (oop) bending occurs in the range 1000 – 650 cm-1 C=C stretch occurs at 1660 – 1600 cm-1; often conjugation moves C=C stretch to lower frequencies and increases the intensity