Download
1 / 1
10 likes | 114 Vues
:. Disparities in Access to Income-Related Social Service Agencies. Scott R. Bauer ScM 1 , Michael Monuteaux ScD 2 , Eric Fleegler MD MPH 3. 1 Department of Epidemiology, Harvard School of Public Health;

E N D
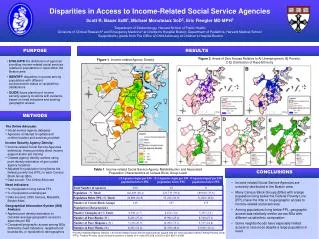
: Disparities in Access to Income-Related Social Service Agencies Scott R. Bauer ScM1, Michael Monuteaux ScD2, Eric Fleegler MD MPH3 1Department of Epidemiology, Harvard School of Public Health; Divisions of Clinical Research2 and Emergency Medicine3 at Children’s Hospital Boston; Department of Pediatrics, Harvard Medical School Supported by grants from The Office of Child Advocacy at Children’s Hospital Boston PURPOSE RESULTS Figure 2. Areas of Zero Access Relative to A) Unemployment, B) Poverty, C-E) Distribution of Race/Ethnicity Figure 1.Income-related Agency Density • EVALUATE the distribution of agencies providing income-related social services relative to populations in need within the Boston area • IDENTIFY disparities in access among populations with different socioeconomic status or racial/ethnic distributions • GUIDE future planning of income security agency locations with evidence based on need indicators and existing geographic access METHODS • The Online Advocate: • Social service agency database • Agencies contacted to update and confirm location and services provided • Income Security Agency Density: • Income-related Social Service Agencies defined as those providing direct income support and/or job training • Created agency density surface using point density estimation of geo-coded agency locations • Adjusted for population living below the federal poverty line (FPL) in each Census Block Group (BG) • Data source: The Online Advocate • Need indicators: • % of population living below FPL • % of population unemployed • Data sources: 2000 Census, MassGIS, Boston Atlas • Geographical Information System (GIS) Analysis: • Applied point density estimation to calculate average geographic access to agencies per BG • Compared geographic access among BGs defined by need indicators, neighborhood boundaries, or racial/ethnic demographics Table 1. Income-related Social Service Agency Maldistribution and Associated Population Characteristics at Census Block Group Level CONCLUSIONS • Income-related Social Service Agencies are unevenly distributed in the Boston area • Many Census Block Groups (BGs) with a large population living below the Federal Poverty Line (FPL) have the little or no geographic access to income-related social services • Among populations living below FPL, geographic access was relatively similar across BGs with different racial/ethnic composition • Some neighborhoods have especially limited access to resources despite a large population in need * Poverty-Adjusted Agency Density = # Income-related Social Service Agencies per square mile per 100 population below Federal Poverty Level **FPL= Federal Poverty Level (Annual income for a family of 4 under $13,359 in 2000 or $21,954 in 2009)