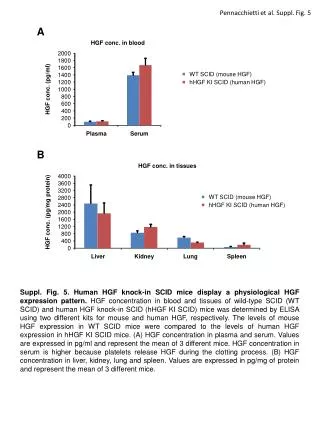
Cao et al. (2000) Gene
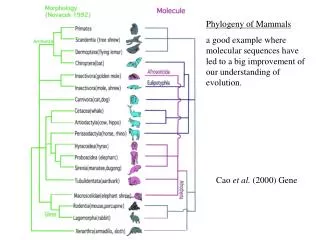
Phylogeny of Mammals a good example where molecular sequences have led to a big improvement of our understanding of evolution. Cao et al. (2000) Gene.

Cao et al. (2000) Gene
E N D
Presentation Transcript
Phylogeny of Mammals a good example where molecular sequences have led to a big improvement of our understanding of evolution. Cao et al. (2000) Gene
rRNA structure is conserved in evolution.The sequence changes slowly. Therefore it can be used to tell us about the earliest branches in the tree of life.
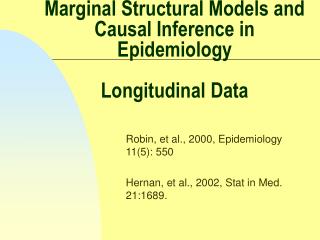
69 Mammals with complete motochondrial genomes. Used two models simulatneously Total of 3571 sites = 1637 single sites + 967 pairs Hudelot et al. 2003
Phylogenetic Methods • Distances • Clustering Methods • Likelihood Methods • Parsimony Recommended books: P. G. Higgs and T. K. Attwood – Bioinformatics and Molecular Evolution R. Page and A. Holmes – Molecular evolution: a phylogenetic approach W. H. Li – Molecular evolution
Part of sequence alignment of Mitochondrial Small Sub-Unit rRNA Full gene is length ~950 11 Primate species with mouse as outgroup
G G A A C A 2 substitutions happened - only 1 is visible 2 substitutions happened - nothing visible From alignment construct pairwise distances. Species 1: AAGTCTTAGCGCGAT Species 2: ACGTCGTATCGCGAT * * * D = 3/15 = 0.2 D = fraction of differences between sequences BUT - D is not an additive distance, D does not increase linearly with time.
Models of Sequence Evolution rijis the rate of substitution from state i to state j States label bases A,C,G & T i Pij(t) = probability of being in state j at time t given that ancestor was in state i at time 0. t j
d = D d D = 3/4 D Jukes - Cantor Model All substitution rates = a All base frequencies are 1/4 t = 2t Mean number of substitutions per site: d increases linearly with time
The HKY model has a more general substitution rate matrix to from The frequencies of the four bases are kis the transition-transversion rate parameter * means minus the sum of elements on the row
Part of the Jukes-Cantor Distance Matrix for the Primates example Baboon Gibbon Orang Gorilla PygmyCh. Chimp Human Baboon 0.00000 0.18463 0.19997 0.18485 0.17872 0.18213 0.17651 Gibbon 0.18463 0.00000 0.13232 0.11614 0.11901 0.11368 0.11478 Orang 0.19997 0.13232 0.00000 0.09647 0.09767 0.09974 0.09615 Gorilla 0.18485 0.11614 0.09647 0.00000 0.04124 0.04669 0.04111 PygmyChimp 0.17872 0.11901 0.09767 0.04124 0.00000 0.01703 0.03226 Chimp 0.18213 0.11368 0.09974 0.04669 0.01703 0.00000 0.03545 Human 0.17651 0.11478 0.09615 0.04111 0.03226 0.03545 0.00000 Mouse-Primates ~ 0.3 Use as input to clustering methods
Distance Matrix Methods Follow a clustering procedure on the distance matrix: 1. Join closest 2 clusters 2. Recalculate distances between all the clusters 3. Repeat 1 and 2 until all species are connected in a single cluster. Initially each species is a cluster on its own. The clusters get bigger during the process, until they are all connected to a single tree. Neighbour Joining method is commonly used clustering method
i n n j k but ... Neighbour-Joining method Take two neighbouring nodes i and j and replace by a single new node n. din + dnk = dik ; djn + dnk = djk ; din + djn = dij ; therefore dnk = (dik + djk - dij)/2 ; applies for every k define Let din = (dij + ri - rj)/2 ; djn = (dij + rj - ri)/2 . Rule: choose i and j for which Dijis smallest, where Dij = dij - ri - rj .
Orangutan Gorilla PygmyChimp Gibbon Chimp Human Marmoset The tree has been rooted using the Mouse as outgroup Baboon SakiMonkey Mouse Lemur 47 0.1 Tarsier Mouse SakiMonkey 100 Tarsier Marmoset Lemur 100 Baboon 100 Gibbon 100 Orang 99 Gorilla 100 Human 84 PygmyChimp 0.1 100 Chimp NJ method produces an Unrooted, Additive Tree Additive means distance between species = distance summed along internal branches
x x t1 t1 t2 t2 A y G z The Maximum Likelihood Criterion Calculate the likelihood of observing the data on a given the tree. Choose tree for which the likelihood is the highest. Can calculate total likelihood for the site recursively. Likelihood is a function of tree topology, branch lengths, and parameters in the substitution rate matrix. All of these can be optimized.
Mouse Lemur 47 Tarsier SakiMonkey 100 Marmoset 100 Baboon 100 Gibbon 100 Orang 99 Gorilla 100 Human 84 PygmyChimp 0.1 100 Chimp Using ML to rank the alternative trees for the primates example The NJ Tree has: (Gorilla,(Human,(Chimp,PygmyCh))) ((Lemur,Tarsier),Other Primates)) Tree log L difference S.E. Significantly worse 1 -5783.03 0.39 7.33 no NJ tree 2 -5782.64 0.00 <-------------best tree (Human,(Gorilla,(Chimp,PygmyCh))) 3 -5787.99 5.35 5.74 no ((Human,Gorilla),(Chimp,PygmyCh)) 4 -5783.80 1.16 9.68 no (Lemur,(Tarsier,Other Primates)) 5 -5784.76 2.12 9.75 no (Tarsier,(Lemur,Other Primates)) ???????????????????????????????????????????????????????????????????? 6 -5812.96 30.32 15.22 yes (Gorilla,(Chimp,(Human,PygmyCh))) 7 -5805.21 22.56 13.08 no Orang and Gorilla form clade 8 -5804.98 22.34 13.15 no Gorilla branches earlier than Orang 9 -5812.97 30.33 14.17 yes Gibbon and Baboon form a clade
1 2 + 3 + * + + A(0) C(1) B(0) D(1) A(0) C(1) B(0) D(1) The Parsimony Criterion Try to explain the data in the simplest possible way with the fewest arbitrary assumptions Used initially with morphological characters. Suppose C and D possess a character (1) that is absent in A and B (0) A(0) B(0) C(1) D(1) In 1, the character evolves only once (+) In 2, the character evolves once (+) and is lost once (*) In 3, the character evolves twice independently The first is the simplest explanation, therefore tree 1 is to be preferred by the parsimony criterion.
E(G) C(T) A(T) A(T) * * * B(T) B(T) D(G) D(G) C(T) E(G) A(T) E(G) C(T) A(T) * * B(T) D(T) B(T) D(T) C(T) E(G) This site is non-informative. Whatever the arrangement of species, only one mutation is required. To be informative, a site must have at least two bases present at least twice. The best tree is the one that minimizes the overall number of mutations at all sites. Parsimony with molecular data 1. Requires one mutation 2. Requires two mutations By parsimony, 1 is to be preferred to 2.
Nearest neighbour interchange Subtree pruning and regrafting Searching Tree Space Require a way of generating trees to be tested by Maximum Likelihood, or Parsimony. No. of distinct tree topologies N Unrooted (UN) Rooted (RN) 3 1 3 4 3 15 5 15 105 6 105 945 7 945 10395 UN = (2N-5)UN-1 RN = (2N-3)RN-1 Conclusion: there are huge numbers of trees, even for relatively small numbers of species. Therefore you cannot look at them all.
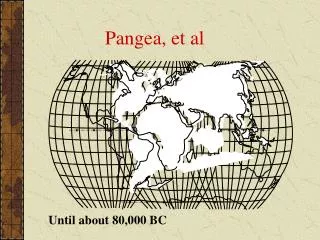
Dating from phylogeniesThe molecular clock known to be 100 m.y. must be approx 50 m.y. must be approx 150 m.y. Can lead to controversies because the clock does not always go at a constant rate
Mammalian orders (primates, rodents, carnivores, bats ....) Molecular dates tend to be earlier (100 m.y.) than those coming from the fossil record (65 m.y.)
Animal phyla - Molecular phylogenies are resolving the relationships between phyla that were not understood from morphology. Still uncertainty about dates - Molecular dates suggest about 1 b.y.Earliest fossil evidence is 560 m.y. Old morphological phylogeny New molecular phylogeny
Molecular dating of key events in early evolution Puts LUCA just prior to 4, and origin of eukaryotes at 2.7. Origin of cyanobacteria is at 2.5, whereas they are claimed to be present in the fossil record at 3.5.