
Investigation of O2- Production in Response to fMLF and PMA in Controlled Conditions
This study examines the production of superoxide (O2-) as a response to various concentrations of fMLF and PMA over time. Utilizing a series of experiments, we quantified O2- production in percentage and measured cellular responses under different conditions, including control and PTX treatments. The findings contribute valuable insights into the signaling pathways activated by these agonists, and how they influence reactive oxygen species production in immune cells. Data are presented for time points and concentration variations of stimulants.

Investigation of O2- Production in Response to fMLF and PMA in Controlled Conditions
E N D
Presentation Transcript
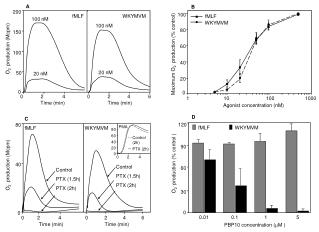
A B 200 fMLF WKYMVM 100 fMLF 100 nM WKYMVM 100 nM 80 150 Maximum O2- production (% control) 60 O2- production (Mcpm) 100 40 20 nM 20 nM 50 20 0 0 0 0 6 2 4 2 4 1 10 100 1000 Time (min) Time (min) Agonist concentration (nM) D C 80 120 fMLF WKYMVM fMLF WKYMVM PMA 80 60 40 90 20 0 0 2 4 40 O2- production (% control ) O2- production (Mcpm) Control PTX (1.5h) PTX (2h) Control PTX (1.5h) PTX (2h) 60 30 0 0 0 2 4 0 2 4 6 0.01 0.1 1 5 Time (min) Time (min) PBP10 concentration (M ) Control (2h) PTX (2h)