Download
1 / 10
150 likes | 694 Vues
Materials Properties and Materials Selection Charts. A Quick Review of Major Materials Properties. Density Elastic modulus: Young’s modulus (E) , Shear modulus (G=E/[2(1+ )]) and Bulk modulus (K=E/[3(1-2 )]) ; Poisson’s ratio ( ) Yield Strength ( y ) Modulus of Rupture

E N D
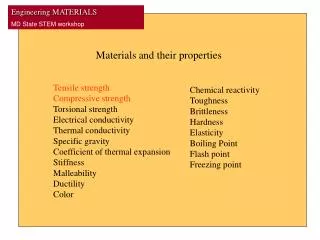
A Quick Review of Major Materials Properties • Density • Elastic modulus: Young’s modulus (E), Shear modulus (G=E/[2(1+)])and Bulk modulus (K=E/[3(1-2)]); Poisson’s ratio () • Yield Strength (y) • Modulus of Rupture • Ultimate Tensile Strength (u) • Hardness
A Quick Review of Major Materials Properties • Toughness (Gc) and Fracture Toughness (Kc) • Loss Coefficient (): measure the capacity for dissipating vibrational energy • Fatigue ratio: ratio of the fatigue limit to the yield strength
A Quick Review of Major Materials Properties • Thermal conductivity, • Thermal diffusivity, for transient heat flux • Melting temperature, Tm and Glass transition temperature, Tg
A Quick Review of Major Materials Properties • Linear thermal-expansion coefficient, • Creep exponent, n; Activation energy, Q; reference stress, 0; kinetic factor, A • Thermal shock resistance • Wear resistance • Corrosion rate
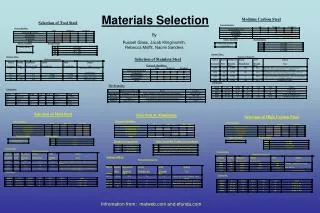
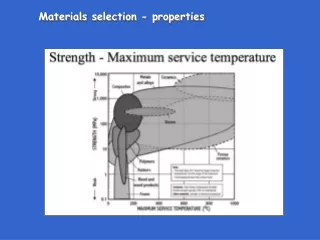
Materials Selection Charts • Usually the performance of a component depends on more than one property • Plotting charts of one property vs. the other reveals the correlations between properties and facilitates optimization • For most load-bearing components, performance are quantified by a combination of properties (The Performance Indices)
Materials Selection Charts • Examples of Performance Indices are (E1/2/) for beam, (f2/E) for spring and (f/E) for thermal shock resistance. • The materials property charts provide convenient tool for applying design constraints and optimizing performance indices