Download
1 / 1
10 likes | 80 Vues
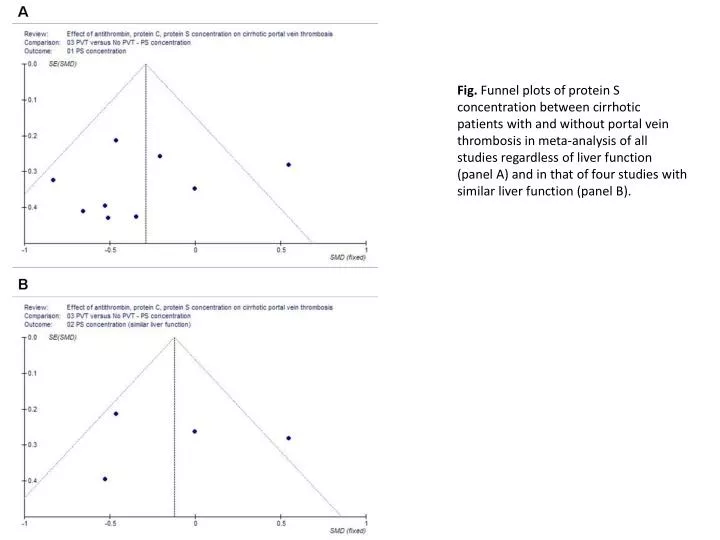
Fig. Funnel plots of protein S concentration between cirrhotic patients with and without portal vein thrombosis in meta-analysis of all studies regardless of liver function (panel A) and in that of four studies with similar liver function (panel B).

E N D
Fig. Funnel plots of protein S concentration between cirrhotic patients with and without portal vein thrombosis in meta-analysis of all studies regardless of liver function (panel A) and in that of four studies with similar liver function (panel B).