Download
1 / 19
190 likes | 275 Vues
This study investigates the familial clustering of child mortality risks in Kenya, focusing on the determinants and differentials impacting mortality. It addresses the implications of data structure, sources of unobserved heterogeneity, and the use of random-effect models to analyze the data collected from the Demographic and Health Survey for Kenya in 1998. The research explores how family-level factors influence child mortality rates and draws on a conceptual framework that considers individual and household characteristics as well as socio-economic and socio-cultural factors. The findings aim to contribute to public health strategies for reducing child mortality in Kenya.

E N D
Family-level clustering of childhoodmortality risk in Kenya D. Walter Rasugu Omariba Department of Sociology Population Studies Centre University of Western Ontario London, Ontario
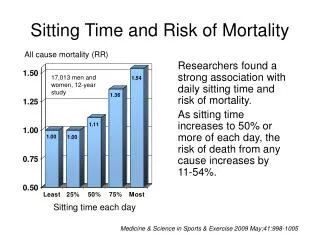
Background • Mortality decline in Kenya began in late 1940s. • E.g. under-five mortality: 220 in 1958-62 period, declined to 89 in 1984-1989 period • Reversals in the downward trend started in 1986 (see figure 1). • Infant mortality increased by 24 % and • Under-five mortality by 25 % in 1988-98 period.
Figure 1: Child mortality trends 1974-1998, Kenya Source: National Council for Population and Development and Macro International, 1989, 1994; 1999.
Focuses on determinants and differentials of mortality (See, for instance, Kibet, 1981; Ewbank et al., 1986; Kichamu, 1986; Omariba, 1993; Obungu et al., 1994; Ikamari, 2000). This study’s focus: Familial child death clustering: In the literature, defined in two ways: 1) Expected vs. observed- Higher observed deaths indicate death clustering 2) Control for unobserved heterogeneity through inclusion of random effects in models- correlation of risks at different levels. Existing research
Rationale • Random-effects models used yet to be applied on Kenyan data. • Child mortality remains an important public health issue. • Reducing mortality important for sustaining country’s incipient fertility transition.
Sources of unobserved heterogeneity • Differential competence in childcare (Das Gupta, 1997). • Biological factors e.g. genetically determined frailty, ‘improvident maternity’ syndrome (Guo, 1993; Das Gupta, 1997). • Socioeconomic, cultural factors and environmental factors. • All unmeasured and unmeasurable factors.
Death clustering? • In this study: • Measured by unobserved heterogeneity term indicating correlation of risks in family. • Most studies only select one child, truncate data by certain date or ignore first child- Biased results especially when variables such as preceding birth interval and survival status are considered.
Implications of data structure • Children in same family are more alike than children from different families. • covariates’ estimates biased. • Consequences of violation of independence: • standard errors of parameters underestimated– spurious precision. • biases baseline hazard duration pattern downward in survival analysis.
Implications of data structure • Random-effects models: Correct for the biases in parameter estimates, provides correct standard errors and correct confidence intervals and significance tests • Separates impact of individual and social context • If contextual effects significant, using a random effect (or multilevel model is reasonable). If not, then we need only adjust the error term for dependence of units.
Data and methods • Data source: Demographic and Health Survey for Kenya, 1998. • 7,881 women 15-49, all marital statuses from 8,380 households and 8,233 eligible women. • 3,407 husbands/partners of the women • Largely rural sample, 81.4% of the women’s sample • Methods: • Weibull hazard models and random-effect hazard models. • The latter tests for family-level variance.
Conceptual framework • Study is guided by the Mosley and Chen (1984) ‘proximate determinants’ model (see Figure 2). • Individual characteristics: Migration status, education, year of birth, ethnicity, religion, survival status of preceding child, birth interval, birth order and maternal age at birth. • Household characteristics: socioeconomic status, sanitation and source of water.
Figure 2:Conceptual framework for studying the determinants of infant and childhood mortality Proximate Determinants Distant Factors -Reproductive healthcare behaviour e.g. prenatal care, place of delivery, delivery care, tetanus injection, breastfeeding -Biodemographic factors e.g. maternal age at birth, birth interval, birth order, age at marriage, child loss experience -Household environmental conditions e.g. source of water, toilet facility. -Socio-economic factors: e.g. maternal & paternal education, place of residence, region, migration, occupation, household socioeconomic status, marital status, year of birth, period of child birth. -Socio-cultural factors: e.g. religion, ethnicity. Outcome Variable Risk of child death
Data description: • Of the 7881, 5716 had at least one child, while 2165 had never had a child. • 23348 children born to 5716 women (family) • 2325 children had died before their fifth birthday: • Infancy- 1620(0-12 months) • Childhood- 705 (Age 13-59 months)
Table 3: Distribution of children and child deaths per family in Kenya, DHS 1998
Does clustering exists? • Over 80 percent of the children belong to families contributing two or more children to the sample. • Families with six or more children comprise about 28 percent of the families yet contribute over half of the children. • 57 percent of the deaths occurred to 8.6 percent of the families with two or more deaths. • About 2 percent of the families contribute four or more deaths; together accounting for about 18 percent of the deaths.
Results • There is significant unobserved heterogeneity both in infancy and childhood (Tables 3 &4): • The estimated random parameters, θ, in the models with unobserved heterogeneity are 0.40 and 0.78 for infant and child mortality respectively. • There is significant familial variation in the risk of infant and child death. • Maternal education, period of birth, ethnicity, type of toilet facility, birth interval and maternal age at birth of child important for both infant and child survival (Tables 1&2). • Migration status, religion, survival status of previous child and birth order significant only for infant mortality, while household SES significant only for child mortality.
Results • There are large ethnic differences in risk of death with children Luo mothers being most disadvantaged. • Secondary or higher education associated with a 22 % and 42% reduction in risk of infant mortality and child mortality respectively. • Risk of infant death higher for children born after 1990, while that of child death is higher for all children born after 1985. • The risk of infant death is higher for children whose sibling died, were born less than 19 months after preceding sibling, and when the mother was less than 20.
Conclusions • The determinants of death have different effects on infant and childhood mortality. Biodemographic factors have greater effect in infancy, while education and ethnicity have greater effect in childhood. • Suggests varied policy actions: • Infancy: longer birth intervals through family planning and breastfeeding, later age at birth etc. • Childhood: improvement in education, socioeconomic status and poverty eradication programs.
Conclusions • Death clustering is non-ignorable – Needs further research: • Healthcare factors- Information available only for children born three years before the survey. • Qualitative research at community level. • Death clustering, another measurement: Consider unobserved heterogeneity in the context of each woman’s sequence of births. The heterogeneity term used in this paper does not reflect this fact.