The Nitrogen Cycle
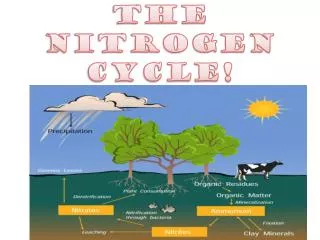
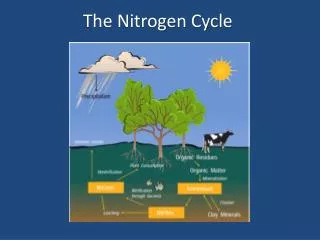
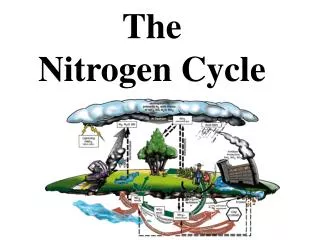
The Nitrogen Cycle. Sources of Nitrogen N is abundant on earth, but only about 2% is available to organisms as reactive nitrogen (NO x , NH x , Org N) N is made available by Nitrogen-fixation and by fertilizer production Gaseous N 2 NO 3

The Nitrogen Cycle
E N D
Presentation Transcript
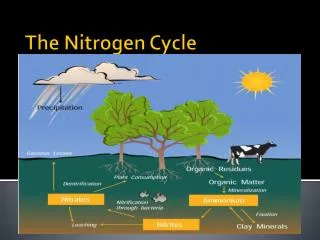
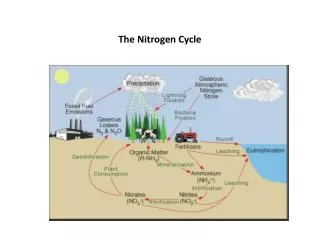
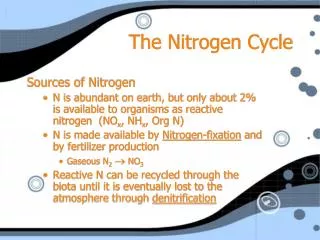
The Nitrogen Cycle Sources of Nitrogen • N is abundant on earth, but only about 2% is available to organisms as reactive nitrogen (NOx, NHx, Org N) • N is made available by Nitrogen-fixation and by fertilizer production • Gaseous N2 NO3 • Reactive N can be recycled through the biota until it is eventually lost to the atmosphere through denitrification
Nitrogen inputs to lakes • Atmospheric deposition from combustion of fossil fuels [dryfall] (NO3,NH4, Organic N) • Atmospheric deposition has doubled every 34 yrs • Watershed inputs • Terrestrial systems are generally N-limited, therefore most N is retained on land and not exported to via streams to lakes
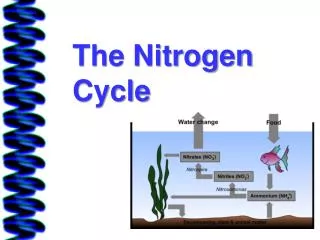
Nitrogen Transformations • NH4+ (ammonium) uptake by algae. • NH4+ PON (Particulate Organic Nitrogen) • No change in oxidation state - not a redox reaction. • takes least amount of energy, therefore preferred by algae. • High concentrations of NH4+ in aerobic aquatic conditions are usually an indication of pollution by sewage or feedlot runoff. • Most other reactions are mediated by bacteria • Ammonification NH4+ production • decomposition of PON NH4+
Nitrogen Transformations • Nitrification NH4+(ammonium) + 3/2 O2 NO2–(nitrite) + 2H+ + H2O then, NO2– + 1/2 O2 NO3– (nitrate) • NO2– usually does not build up • NO3is the final product of nitrification. It may build up in conditions where there is much NH4+ being produced, oxygen is present, but there is little vegetation to take up NO3 • Assimilative nitrate reduction • NO3- uptake by algae • algal uptake of N to make more cells. NO3– ORG-N (NH3) • needs light, done with O2 present.
Nitrogen Transformations • Denitrification (dissimilatory nitrate reduction) CHO + NO3- + H+ CO2 + N2 + H2O • must be anaerobic – • sediments, anoxic hypolimnia. • Nitrogen fixation • N2 ORG-N (NH3). • Difficult to break triple bond of N2 therefore energetically expensive • May be conducted by Cyanobacteria (Blue-green algae) under bright sunlight • Or by bacteria in sediments, coupled with other reactions. • Both cases require anoxic conditions for reaction to occur
Nitrogen fixation in Cyanobacteria • Nitrogen fixation occurs in special cells called heterocysts, but • Not all cyanobacteria have heterocysts or can fix nitrogen • Some cyanobacteria can fix nitrogen without heterocysts www.micrographia.com/specbiol/bacteri/bacter/bact0200/anabae03.jpg www.bio.purdue.edu/people/faculty/sherman/ShermanLab
Redfield ratios of ocean phytoplankton (by number of atoms) C H O N P S Fe 106 263 110 16 1 0.7 0.01 Hecky et al. compiled data from lakes around the world to see if the ratios held true for lakes (as well as the ocean)
N:P ratio Lakes with N:P ratio > 22 are considered to be P-limited Note also C:N and C:P ratios. If they are higher than the Redfield ratio it means that algal cells are making do with less N or P than they would like. Mean N:P ratio = 24
N:P = 13, 11 for Lakes Victoria and Albert Some large tropical lakes can be severely nitrogen limited
What about C:P ratios? C:P is usually above the Redfield ratio meaning that algae is usually P-limited relative to C
What about N:C ratios? N:C is also usually above the Redfield ratio meaning that algae is usually N-limited relative to C Therefore, freshwater phytoplankton is usually both N and P limited relative to C. Ie. The cells are making do with less than optimal N and P. But, P is usually more limiting than N
Finally, recent studies show that the Redfield N:P ratio of 16 is not a universal biochemical optimum for phytoplankton, but rather an average of ratios for many different species. Christopher A. Klausmeier, Elena Litchman, Tanguy Daufresne and Simon A. Levin Nature 429, 171-174(13 May 2004)