Download
1 / 35
360 likes | 928 Vues
Volatile Organic Compounds in Pesticides. Randy Segawa February 13, 2003. Agenda. Background Method for Estimating VOC Emissions Amount of Pesticide VOC Emissions – Inventory Uncertainties in Emission Estimates Next Steps. VOCs and Air Pollution.

E N D
Volatile Organic Compounds in Pesticides Randy Segawa February 13, 2003
Agenda • Background • Method for Estimating VOC Emissions • Amount of Pesticide VOC Emissions – Inventory • Uncertainties in Emission Estimates • Next Steps
VOCs and Air Pollution • Volatile organic compounds (VOC) and nitrogen oxides (NOx) react with sunlight to form the air pollutant ozone • Ozone causes respiratory irritation and illnesses; state standard 0.09 ppm for 1-hour • Many pesticide active and inert ingredients are VOCs • The Department of Pesticide Regulation (DPR) and the Air Resources Board (ARB) develop plans and take actions to estimate and reduce VOC emissions from pesticides
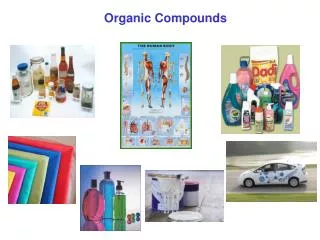
Sources of VOCs • Numerous sources of VOCs such as vehicles, manufacturing, consumer products, agriculture • Relative contribution of the sources varies with area and year • San Joaquin Valley has highest contribution from agricultural sources; top sources in 1999: • Livestock wastes • Light duty passenger vehicles • Light and medium duty trucks • Oil and gas production • Agricultural pesticides
State Implementation Plan • As required by the Clean Air Act, ARB and Air Pollution Control Districts (APCD) develop State Implementation Plans (SIP) to reduce VOCs and NOx • 1994 SIP requires DPR to reduce VOC emissions from pesticides by 20% between 1990 and 2005 in 5 nonattainment areas
Nonattainment Areas Sacramento Metro San Joaquin Valley Ventura South Coast Southeast Desert
Method for Estimating VOCs • DPR maintains an inventory of VOC emissions from agricultural and commercial structural applications of pesticide products • VOC emission from a pesticide product is: emission = %VOC in product x amount of product
Estimating %VOC in Products • In 1994, DPR requested %VOC (emission potential) data for all agricultural and structural products • Emission potential for each product determined by one of four methods: • Lab test (thermogravimetric analysis, TGA) • Water/Inorganic subtraction • Estimated from confidential statement of formula • Default value
Default Emission Potentials • DPR has estimated emission potentials for 27% of the 11,000+ products included in the inventory by TGA, water/inorganic subtraction, or CSF. • Remaining 73% of the products are assigned a default value based on formulation category • Old Default: highest TGA value • New Default: median TGA value • Highest value used to encourage submission of data • Median value used to obtain best estimate of emissions
Estimating Amount of Product • VOC emission from a pesticide product is: emission = emission potential x amount of product • Amount of product determined from pesticide use reports • Pesticide use reports contain information on • Product applied • Amount applied • Date of application • Location of application • Commodity or site treated
Pesticide Use Reports (PUR) • Since 1990, all agricultural pesticide applications must be reported to the county agricultural commissioner • Partial reporting of structural, industrial, institutional, and other uses • Ag commissioners transfer the data to DPR. DPR compiles and maintains a PUR database • PUR database contains approximately 2 million records for each year
Emission Inventory Calculations • Using emission potential data and PUR data, VOC emissions from agricultural and commercial structural applications calculated statewide for all years beginning with 1990 base year. • Each year of inventory updated annually based on most recent PUR data and emission potential data; approximately 1 year lag • Inventory focuses on: • May – Oct (peak ozone period) for each year • 5 nonattainment areas
Emission Inventory • Sacramento Metro Nonattainment Area • San Joaquin Valley Nonattainment Area • Southeast Desert Nonattainment Area • Ventura Nonattainment Area • South Coast Nonattainment Area
Sacramento Emission Inventory 20% required reduction
2001 Sacramento Emissions • Pesticide inventory comprised of • 90% agricultural • 10% commercial structural • 27% fumigants • Products with highest contribution contain • Metam-sodium • Molinate • Methyl bromide • Chlorpyrifos • Cypermethrin
San Joaquin Emission Inventory 20% required reduction
2001 San Joaquin Valley Emissions • Pesticide inventory comprised of • 98% agricultural • 2% commercial structural • 52% fumigants • Products with highest contribution contain • Metam-sodium • Dichloropropene • Methyl bromide • Chlorpyrifos • Oxyfluorfen
Southeast Desert Emission Inventory 20% required reduction
2001 Southeast Desert Emissions • Pesticide inventory comprised of • 96% agricultural • 4% commercial structural • 83% fumigants • Products with highest contribution contain • Metam-sodium • Methyl bromide • Dichloropropene • Gibberellins • Hydrogen cyanamide
Ventura Emission Inventory 20% required reduction
2001 Ventura Emissions • Pesticide inventory comprised of • 99.7% agricultural • 0.3% commercial structural • 88% fumigants • Products with highest contribution contain • Methyl bromide • Dichloropropene • Metam-sodium • Chlorpyrifos • Chloropicrin
South Coast Emission Inventory 20% required reduction
2001 South Coast Emissions • Pesticide inventory comprised of • 57% agricultural • 43% commercial structural • 35% fumigants • Products with highest contribution contain • Methyl bromide • Diazinon • Chlorpyrifos • Permethrin • Metam-sodium
Summary of Emission Inventory • 2001 emissions meet the 2005 goal in 3 nonattainment areas: Sacramento Metro, San Joaquin Valley, and South Coast • 2001 emissions do not meet the 2005 goal in 2 nonattainment areas: Southeast Desert and Ventura • All 5 nonattainment areas must meet the 2005 goal in 2005 • VOC emissions parallel pesticide use • Fumigants are major contributors in all nonattainment areas
Uncertainties in Emission Inventory • Uncertainties in pesticide use • Uncertainties in emission potentials • Other uncertainties • Effects of uncertainties
Uncertainties in PUR • Approximately 5% of the PUR records contain errors • Uncertain compliance in reporting • Likely greater number of errors and lower compliance in early 1990s
Uncertainties in Emission Potentials • Emission potentials are unknown for 73% of the products, comprising 20% of use in 1990, and 16% of use in 2001 • Inventory may include emission potential errors or inappropriate values; metam-sodium and sodium chlorate recently revised • Emission potentials may not indicate actual emission rates in the field
Other Uncertainties • Limited data available to forecast future emissions • The proportion of each chemical (active and inert ingredients) in the inventory (speciation profile) is uncertain • Ability to create ozone (reactivity) for many pesticides is unknown; amount of reactive organic gases (ROG) is the critical parameter
Effects of Uncertainties • Base year has greater use of products with default emission potentials; changes in default values have greater impact on base year, relative to other years • Base year emissions may be underestimated due to lower reporting compliance, relative to later years • Base year varies from year to year • Base year changes when emission potential data revised • Base year changes when “improvements” incorporated • San Joaquin Valley changed from meeting to not meeting the 1999 interim goal when default changed
Next Steps • Pesticide Emission Inventory • Obtain additional data to forecast emissions • Develop plan for determining more detailed speciation profiles and estimating ROG • Publish the next update, including the 2002 inventory, in late-2003 or early-2004
Next Steps • Regulatory Activities • South Coast and San Joaquin Valley will prepare new SIPs in 2003 that will describe measures to achieve air quality standards by 2010 • South Coast will not need any additional VOC reductions from pesticides • San Joaquin Valley will need approximately 30% more VOC reduction from all sources between 1999 and 2010
Opportunities for Stakeholders • Emission Inventory • Provide data on emission potentials • Provide data on speciation and reactivity • Provide data on current and future pesticide use • Reduction Activities • Work with DPR and ARB to develop options for reducing VOC emissions • Work with DPR and ARB to adopt practices that reduce VOC emissions
Questions/Additional Information Randy Segawa Senior Environmental Research Scientist Department of Pesticide Regulation PO Box 4015 Sacramento, CA 95812-4015 Phone: (916) 324-4137 Fax: (916) 324-4088 Email: rsegawa@cdpr.ca.gov Web Page: www.cdpr.ca.gov Programs and Services Volatile Organic Compounds Emissions Project