Download
1 / 24
240 likes | 323 Vues
Gross Domestic Product (GDP). Miss Z C104. Economists use a system called National Income Accounting to collect and organize macroeconomic statistics on production, income, investment, and savings.

E N D
Gross Domestic Product (GDP) Miss Z C104
Economists use a system called National Income Accounting to collect and organize macroeconomic statistics on production, income, investment, and savings. Department of Commerce presents this data in the form of NIPA, or National Income and Products Accounts.
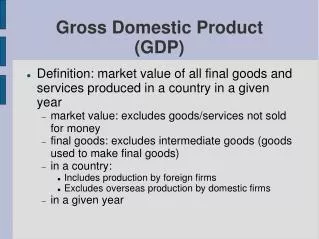
GDP Dollar value of all final goods and services produced within a country’s borders in a given year.
Final Goods and Services • Intermediate Goods: Products used in the production of final goods • Final Goods: Produced and sold to consumers.
Expenditure approach Economists estimate amounts spent annually on four categories of final goods and services: • Consumer goods and services (durable and nondurable goods) • Business goods and services • Government goods and services • Net exports (exports – imports)
DO THIS • An economy only produces computers, shoes, and electric cars. • This year, the economy produces: 200 computers @ $2000 each. 50,000 pairs of shoes @ $100 each. 300 electric cars @ $25,000 each. Calculate GDP for this economy USING THE EXPENDITURE APPROACH.
INCOME APPROACH All incomes in the economy are added together. Why incomes? When a firm sells a product, the selling price minus the dollar value of goods/services purchased from other firms represents income for firm owners and employees.
An economy only produces computers, shoes, and electric cars. All employees, then, work in these industries or related industries. The combined selling price of all computers, shoes, and electric cars reflects money paid to all those who produced the goods. THUS, this year’s GDP is the sum of the income of all working citizens. Combined Income = $12,900,000
Nominal GDP Versus Real GDP
Nominal GDP GDP measured in current prices. Calculated by using current year’s prices to determine the value of the current year’s output. Does not account for increase in prices but not output.
Real GDP GDP is expressed in constant, or unchanging, prices. By using real GDP, economists can find out whether an economy is actually producing more goods and services, regardless of price changes.
YEAR 1: NOMINAL GDP 200 computers @ $2000 each. 50,000 pairs of shoes @ $100 each. 300 electric cars @ $25,000 each. GDP = $12,900,000 200 computers @ $3000 each. 50,000 pairs of shoes @ $400 each. 300 electric cars @ $30,000 each. GDP = $ 29,600,000 YEAR 2: NOMINAL GDP 200 computers @ $2000 each. 50,000 pairs of shoes @ $100 each. 300 electric cars @ $25,000 each. GDP = $12,900,000 YEAR 2: REAL GDP
GDP LIMITATIONS
Nonmarket Activities Goods and services that people make or do themselves. I.E: Caring for children, mowing the lawn, cooking dinner, washing their car, cleaning their room, etc. (It does, however, go up when people pay others to do services for them.)
The Underground Economy Unofficial transactions are not counted. Goods and services purchased on the black market, illegal gambling, or informal transactions do not raise GDP.
Negative Externalities Unintended economic side effects have monetary value that is not reflected in GDP. For instance, the negative result of pollution as a result of factory production is not subtracted from GDP.
Quality of Life Additional goods and services do not necessarily make people any happier.
Aggregate Supply: • Total amount of all goods and services at all price levels. • Aggregate Demand • Amount of goods and services purchased at all possible price levels. • Aggregate Equilibrium • - Any shift in the AS/AD Curve will cause real GDP to change. INFLUENCES ON GDP
(the sellers) (the buyers)
BUSINESS CYCLES (I.E. RISING AND FALLING GDP)
Expansion & Peaks A period of economic growth measured by a rise in real GDP. Marked by a decrease in the unemployment rate and prosperous firm market.
Contractions and Troughs After reaching its peak, an economy enters into contraction, or continuous decrease in GDP. Recessions: • GDP falls for two consecutive quarters (six months) • Generally last from 6 – 18 months. • Unemployment between 8 – 10 percent. Depression: • Especially long and sever recessions. Stagflation: - Decline in real GDP and a rise in price level.
Factors in Business Cycles Business Investment: Investments in equipment, start-up firms, etc. Interest Rates and Credit: Low interest rates spur higher rates of borrowed money from business. Consumer Expectations: Decisions on whether to save or spend money based on future economic predictions. External Shocks: Natural disasters, disruptions in oil supply, wars that interrupt trade, and other outside factors often have severe economic consequences.