Download
1 / 52
520 likes | 750 Vues
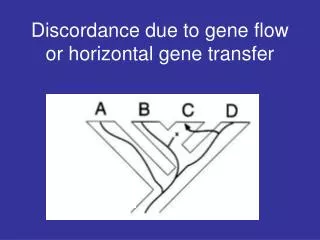
Mike DeGiorgio. Randa Tao. Gene tree discordance and multi-species coalescent models. Noah Rosenberg December 21, 2007. James Degnan. David Bryant. Gene trees and species trees. Different genes may produce different inferences about species relationships. T 2. T 3.

E N D
Mike DeGiorgio Randa Tao Gene tree discordance and multi-species coalescent models Noah Rosenberg December 21, 2007 James Degnan David Bryant
Gene trees and species trees Different genes may produce different inferences about species relationships
T2 T3 Coalescent model for evolution within species, conditional on the species tree Hudson (1983, Evolution) Tajima (1983, Genetics) Nei (1987, Molecular Evolutionary Genetics book) Pamilo & Nei (1988, Molecular Biology and Evolution) Takahata (1989, Genetics) Wu (1991, Genetics) Hudson (1992, Genetics) Maddison (1997, Systematic Biology)
T2 T3 Assumptions of the multispecies coalescent model conditional on a species tree 1. Coalescences occur within species, with the same rate for each lineage pair. 2. The rate of coalescence is proportional to the number of pairs of lineages. 3. When species splits are encountered, lineages from all groups descended from the split are allowed to coalesce.
The probability that i lineages have j ancestors at T coalescent time units (T = t / N ) in the past is a[k] = a(a-1)…(a-k+1) a(k) = a(a+1)…(a+k-1) Takahata and Nei (1985, Genetics) Tavare (1984, Theoretical Population Biology)
For 3 taxa, the probability of concordance is a sum of two terms: T A B C Probability of concordance equals 1-(2/3)e-T Probability of a concordant gene tree topology Concordant gene tree Discordant gene tree 1. The probability gene tree is determined in the 2-species phase, or 1-e-T 2. 1/3 of the probability that gene tree is determined in the ancestral phase, or (1/3)e-T Hudson (1983, Evolution) Nei (1987, Molecular Evolutionary Genetics) Tajima (1983, Genetics)
Probability of the matching gene tree ((AB)C) Probability of a particular discordant gene tree ((BC)A)
It would be desirable to have a general computation of the probability that a particular species tree topology with branch lengths gives rise to a particular gene tree topology
Gene tree probabilities under the multispecies coalescent model A coalescent history gives the list of species tree branches on which gene tree coalescences occur. A B C A B C Consider a species tree S (topology and branch lengths) Consider a species tree G (topology only) JH Degnan & LA Salter Evolution 59: 24-37 (2005)
((AC),B) (D,E) (((AC)B,(DE)) Probability (A,C) gij(T) is the probability that i lineages coalesce to j lineages during time T The list of coalescent histories for an example with five taxa Gene tree Species tree 1 2 3 4 A B C D E A C B D E
Computing the probabilities of gene trees What are the properties of the number of coalescent histories? Using the probabilities of gene trees Is it possible for the most likely gene tree to disagree with the species tree? How do species tree inference algorithms behave when applied to multiple gene trees?
8 7 6 AS,m is the number of coalescent histories for the matching gene tree when we subdivide the species tree root into m pieces 5 3 1 4 2 A B C D E F The number of coalescent histories for the matching gene tree
The number of coalescent histories for trees with at most 5 taxa
Catalan number Cn-1 (Degnan 2005) 1, 2, 5, 14, 42, 132, 429, 1430… -, -, -, 13, 42, 138, 462, 1573… Number of taxa in left subtree is l Number of coalescent histories for special shapes with n taxa
Ratio of the largest and smallest number of coalescent histories for n taxa >
Which types of shapes have the most coalescent histories? Most The number of coalescent histories for trees with 8 taxa Least
(1.25)Cn-1 (1.4375)Cn-1 ~(5/4)Cn-1 ~(23/16)Cn-1 Caterpillar-like shapes with n taxa, based on 4- and 5-taxon subtrees Cn-1
(5.39453125)Cn-1 (2.953125)Cn-1 ~(1381/256)Cn-1 ~(189/64)Cn-1 Largest values for caterpillar-like shapes based on 7 and 8-taxon subtrees
Can a non-matching gene tree have more coalescent histories? Caterpillar species tree 1430 coalescent histories 1441 coalescent histories
Using the probabilities of gene trees Is it possible for the most likely gene tree to disagree with the species tree? How do species tree inference algorithms behave when applied to multiple gene trees? Computing the probabilities of gene trees What are the properties of the number of coalescent histories?
For n>3 taxa, can species trees be discordant with the gene trees they are most likely to produce?
A B C D A B C D The labeled history for a gene tree is its sequence of coalescence events. The two labeled histories below produce the same labeled topology ((AB)(CD)) Randomly joining pairs of lineages leads to a uniform distribution over the set of possible labeled histories. The number of labeled histories possible for four taxa is
Combined probability 1/9 T2 A B C D A B C D T3 Probability 1/18 A B C D A B C D If the branch lengths of the species tree are sufficiently short, coalescences will occur more anciently than the species tree root.
0.14 0.14 A B C D Gene tree frequency distribution ((AB)(CD)) 0.132 ((AC)(BD)) 0.094 ((AD)(BC)) 0.094 (((AB)C)D) 0.125 (((AB)D)C) 0.100 (((AC)B)D) 0.070 (((AC)D)B) 0.062 (((AD)B)C) 0.032 (((AD)C)B) 0.032 (((BC)A)D) 0.070 (((BC)D)A) 0.062 (((BD)A)C) 0.032 (((BD)C)A) 0.032 (((CD)A)B) 0.032 (((CD)B)A) 0.032 Species tree Matching gene tree
T3 T2 (units of N generations) Species tree is (((AB)C)D) but most likely gene tree is ((AB)(CD)) T2 T3 Species tree is (((AB)C)D) Most likely gene tree is not (((AB)C)D) A species tree topology produces anomalous gene trees if branch lengths can be chosen so that the most likely gene tree topology differs from the species tree topology.
Combined probability 1/9 T2 A B C D A B C D T3 A B C D Probability 1/18 A B C D Does the 4-taxon symmetric species tree topology produce anomalous gene trees?
3 species – no anomalous gene trees. • 4 species – asymmetric but not symmetric species trees have AGTs. • 5 or more species? Probability of the concordant gene tree Probability of a particular discordant gene tree
Proof: A labeled topology for n taxa is n-maximally probable if its probability under random branching is greater than or equal to that of any other labeled topology with n taxa. A B C D A B C D E A B C D E F With 5 or more species, any species tree topology produces at least one anomalous gene tree. For n > 4, suppose a species tree topology is not n-maximally probable. If its branches are short enough, it produces AGTs that are n-maximally probable.
With 5 or more species, any species tree topology produces at least one anomalous gene tree. Proof (continued): Suppose a species tree topology is n-maximally probable. For n > 8 an inductive argument reduces the problem to the case of n=5, 6, 7, or 8. For n=5, 6, 7, or 8 taxa it remains to show that the n-maximally probable species tree topologies produce AGTs.
With 5 or more species, any species tree topology produces at least one anomalous gene tree. Proof (continued): For n=5 the n-maximally probable species tree topology produces AGTs.
With 5 or more species, any species tree topology produces at least one anomalous gene tree. Proof (continued): For n=5, 6, 7, or 8 the n-maximally probable species tree topologies produce AGTs.
J G H I With 5 or more species, any species tree topology produces at least one anomalous gene tree. Proof (continued): An inductive argument for n > 8 reduces the problem to the case of n=5, 6, 7, or 8. For n > 8 one of the two most basal subtrees has between 5 and n-1 taxa inclusive. Choose branch lengths to produce an AGT for that subtree, and make them long for the other subtree.
With 5 or more species, any species tree topology produces at least one anomalous gene tree. Proof (summary): If the species tree topology is not n-maximally probable, it has maximally probable AGTs. By example, n-maximally probable species tree topologies produce AGTs for n=5, 6, 7, or 8. For n > 8, induction reduces the problem to the case of n=5, 6, 7, or 8. This completes the proof
A B C D E D E C A B Species tree Gene tree Anomalous gene trees can have the same unlabeled shape as the species tree
There exist mutually anomalous sets of tree topologies (“wicked forests”).
T3 T4 T2 AGTs can occur if some but not all species tree branches are short
T3 T2 (units of N generations) Does the severity of AGTs increase with more taxa? Maximal value for shared branch length that still produces AGTs: 0.1568
What implications do gene tree probabilities have for phylogenetic inference algorithms?
T2 T3 A B C D T3 A B C D A B C D T2 (units of N generations) • Most commonly observed gene tree topology Statistically inconsistent in estimating the species tree Species tree Estimated species tree
Estimated gene tree of concatenated sequence Statistically inconsistent in estimating the species tree
Maximum likelihood based on the frequency distribution of gene tree topologies 0.14 0.14 A B C D Statistically consistent even when anomalous gene trees exist Gene tree frequency distribution Anomalous gene tree ((AB)(CD)) 0.132 ((AC)(BD)) 0.094 ((AD)(BC)) 0.094 (((AB)C)D) 0.125 (((AB)D)C) 0.100 (((AC)B)D) 0.070 (((AC)D)B) 0.062 (((AD)B)C) 0.032 (((AD)C)B) 0.032 (((BC)A)D) 0.070 (((BC)D)A) 0.062 (((BD)A)C) 0.032 (((BD)C)A) 0.032 (((CD)A)B) 0.032 (((CD)B)A) 0.032 Species tree Matching gene tree
Consensus among gene tree topologies -Majority rule consensus -Greedy consensus -Rooted triple consensus (R*)
Tree obtained by agglomeration using minimum pairwise coalescence times across a large number of loci (“Glass tree”)