
Evaluating the Impact of the USDA Fresh Fruit & Vegetable Program in Wisconsin Schools
This study evaluates the effectiveness of the USDA's Fresh Fruit and Vegetable Program (FFVP) in Wisconsin elementary schools after two and six months of implementation. The program, initiated in 2002, aims to improve students' daily fruit and vegetable intake by providing free snacks. Results show that intervention students increased their average daily intake from 1.56 to 1.85 servings, while control students' intake declined. Despite program challenges noted by teachers, preliminary outcomes suggest the FFVP can positively influence students' nutrition behaviors.

Evaluating the Impact of the USDA Fresh Fruit & Vegetable Program in Wisconsin Schools
E N D
Presentation Transcript
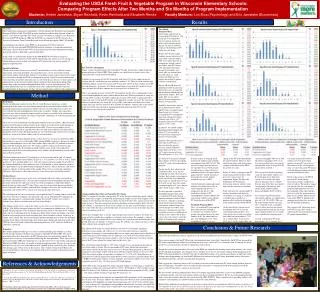
Evaluating the USDA Fresh Fruit & Vegetable Program in Wisconsin Elementary Schools: Comparing Program Effects After Two Months and Six Months of Program ImplementationStudents: Amber Jamelske, Bryan Reinhold, Kevin Reinhold and Elizabeth ReinkeFaculty Mentors: Lori Bica (Psychology) and Eric Jamelske (Economics) Introduction Results OverviewThe United States Department of Agriculture (USDA) initiated the Fresh Fruit and Vegetable Program (FFVP) in 2002. The FFVP provides funding for students from selected schools to receive a free fruit or vegetable (FV) snack 3-4 days a week for an academic year. Wisconsin first received FFVP funding in 2006 and the FFVP was expanded to all 50 states plus the District of Columbia, Guam, Puerto Rico and Virgin Islands through the 2008 US Farm Bill. A chronological description of the FFVP can be found on the USDA website at http://www.fns.usda.gov/cnd/FFVP/FFVPdefault.htm.Similarly, a detailed description of Wisconsin’s involvement in the FFVP can be found on the Wisconsin Department of Public Instruction website at http://dpi.wi.gov/fns/ffvp.html. In this study, we evaluated the impact of the 2008-09 FFVP in Wisconsin using two intervention schools and two control schools. Specifically, this analysis assesses changes in student behavior related to fruit and vegetable (FV) intake after two and six months of program implementation. Snack Distribution The first intervention school served a free FV snack four days a week, while the second intervention school only provided a free snack three days a week. All teachers in both intervention schools allowed their students to eat morning snacks on days when no free snack was served. Even though the FFVP was designed to provide a free FV snack in combination with some form of nutrition education, this was not often the case. In fact, several teachers and administrators in the two intervention schools commented that the program disrupted the normal flow of the classroom and hindered their ability to cover required material. The teachers admitted that this was a dilemma because they understood and believed in the intended benefits of the program, but they felt constrained in their ability to fully implement it. Two Month Program Effect Intervention students had an average daily FV intake of 1.56 on the pre-test compared to 1.81 for control students. In order to provide more detail, Figures 2A and 3A show the respective distributions of FV intake for each group. Nearly 25% of intervention students ate one-half or less FV items daily, while just under 80% ate no more than two. In comparison, control students ate slightly more FV. Almost 15% consumed one-half or fewer FV items daily and nearly 80% ate no more than two-and-a-half. As stated earlier, this difference was largely due to the FV options served at school lunch. Figures 2B and 3B show the distribution of FV intake from the first post-test. As expected, the distribution shifted right for intervention students. Now, just under 10% ate one-half or fewer FV items compared to almost 25% previously. Similarly, almost three-quarters ate no more than two-and-a-half FV items, an improvement from the pre-test. Overall, average daily FV consumption increased among intervention students from 1.56 to 1.85 despite having fewer FV lunch options (2.35 < 2.50). In contrast, the control student distribution shifted slightly left. About 17% ate one-half or fewer FV items compared to almost 15% previously. Similarly, three-quarters ate no more than two FV items, a decrease from the pre-test. Overall, control student FV intake decreased from 1.81 to 1.57 largely because of fewer FV lunch options (2.35 < 2.75). Pre-Test FV Consumption Figure 1 shows the distribution of average daily FV intake for the entire sample before the program began in October 2008. These numbers are calculated as averages across three consecutive days using data from the DILQ. Students ate an average of 1.69 FV items daily with about 95% of the sample having an average daily FV intake between zero and four (std dev=1.13). There were 66 students who reported eating an average of less than one FV item daily and 35 of these students ate no FV over the three days. In contrast, 62 students reported an average daily FV intake of at least three, but only five of these students ate an average of five or more a day. This is not a perfect measure of actual FV consumption, but the data is comparable to other research and highlights that most students do not meet the USDA requirements of eating 5-9 servings of FV each day. To further validate this measure of FV intake a multivariate OLS regression with average daily FV intake as the dependent variable was used. The results (not shown) reveal that boys ate fewer FV (0.52, p<0.01) and students who had at least three family meals per week ate more FV (0.29, p=0.05). In addition, students who ate the school lunch most of the time (instead of bringing lunch from home) ate more FV, but this difference was not statistically significant. Method Participants Fourth and fifth grade students in four West-Central Wisconsin elementary schools participated in this study (two intervention schools and two matched control schools). The participating intervention and control schools were not selected randomly, but rather they were selected for their geographic proximity to the researchers. Despite some constraints, great care was taken to match the control schools as closely as possible to the intervention schools with respect to school size, ethnic composition, and percent of students qualifying for free/reduced price school meals. There were a total of 420 fourth and fifth grade students in the four schools; 208 intervention students and 212 control students. Parents of all students received a letter notifying them of the study and requesting the participation of their child. Consent was granted passively meaning that parents had to sign and return the letter only if they did not want their child to participate in the research. The participation rate was extremely high with just twelve students opting out; seven intervention students and five control students. Data was collected at three different points in time. A pre-test was given in September 2008 followed by two post-tests in December 2008 and April 2009 respectively. Because of student absences and incomplete surveys for some students there were only 392 students in the first data collection. Similarly, there were 397 students and 383 students in the final two data collections respectively. Researchers matched students across all three data collections resulting in a final data set consisting of only those students that provided data in each of the three collection periods. The final sample consisted of 347 participants; 168 intervention students and 179 control students. Approximately equal numbers of girls (n = 171) and boys (n = 176) as well as fourth graders (n = 167) and fifth graders (n = 180) were represented in the sample. Nearly 80% of the students identified as white, while just over 13% identified as Asian American and there was approximately equal representation of Hispanic/Latino(a), African American, and Native American students in the remainder of the sample. There were no statistically significant differences with respect to these characteristics across intervention and control schools. Student Survey Each of the three separate parts to the survey instrument used in this study were based on previously validated measures. The first part contained several demographic items plus four questions about lifestyle (physical activity, fast food consumption, eating family dinners, parental limits on video game/TV time). There were also six questions measuring attitudes toward eating FV where students indicated their willingness to try new FV served at home and school, and to choose FV as snacks instead of less healthy alternatives. The second part of the survey used in this study explored what FV students had ever tried and what items they liked. Students were presented with a list of 69 different FV ranging from apples and asparagus to watermelon and zucchini. For each FV students were asked to indicate if they had ever tried the item and also if they liked it. The third part of the survey used in this study was the A Day in the Life Questionnaire (DILQ). The DILQ is designed to measure the FV consumption of children over a 24-hour period. The questionnaire seeks to facilitate their memory recall of what they ate by walking them step-by-step through their day beginning at home before school and ending at bed-time. Students were asked to write down everything they ate for breakfast at home, on the way to school, and at school. This line of questioning continued through the rest of the day including morning break, lunch, afternoon break, after-school snack, dinner, and night-time snack. The DILQ has been tested and validated for measuring incidences of FV intake for children of elementary school age. Procedure Researchers administered the pre-test survey to fourth and fifth grade students in all four schools during regularly scheduled class periods in September/October 2008. This survey provided baseline data from before the FFVP began in the two intervention schools. Two separate post-test surveys were conducted following the same procedure. These surveys were given in December 2008 after the program was in place for just over two months, and again in March/April 2009 after about six months of program implementation. The pre-test survey and both post-test surveys were each conducted over a period of three consecutive days. Students took all three parts of the survey on the first day, while students took just the DILQ on the second and third days. All surveys were administered in the classroom setting and taken with paper and pencil. It is difficult to accurately interpret these changes without a description of the FV snacks served through the program. On day one the first school served cauliflower (50% ate it), but the second did not offer a free snack on that day. Both schools served papaya on the second day, but it had been frozen and was tainted (only 33% ate it). Lastly, on day three one school served pineapple (81% ate it) and the other served oranges (80% ate it). It is now possible to provide a meaningful interpretation of the average daily FV intake during morning snack presented in Table 2. In terms of vegetable at morning snack, intake increased among intervention students from nearly zero on the pre-test to 0.07. This increase is small because the only vegetable served was cauliflower on one day in one school (out of three survey days). In contrast, vegetable intake at morning snack remained almost zero for control students. In terms of fruit at morning snack, intervention students increased their consumption from 0.051 to 0.39. This increase is larger than the increase for vegetables because both schools served fruit on two days. In fact, it would have been even larger had the papaya not been tainted. In contrast, fruit intake for control students remained very low at 0.074. Overall, both intervention and control students were offered fewer FV at school lunch during post-test 1 compared to the pre-test. This resulted in a decline in FV consumption for control students, but intervention students increased their FV intake because of the FFVP. Six Month Program Effect Next, we examined FV consumption from data collected through a second post-test. Students in both groups were offered nearly the same amounts of FV for school lunch as they were during post-test 1. Thus, we might not expect to see any change in the FV intake distribution for control students. However, there could be an increase for intervention students if the impact of the FFVP has grown over time. Figure 3C shows no change in the FV intake among control students from post-test 1 to post-test 2. In comparison, Figure 3B shows the distribution of FV intake for intervention students shifted to the right, but this increase was minimal. Table 3 presents the average daily FV intake at morning snack from the second post-test. Again, it is difficult to interpret these numbers as a program effect without a description of the snacks provided by the FFVP. On day one the first school served watermelon (92% ate it), but the second school did not offer a free snack on that day. On the second day, one school served cucumbers (73% ate it) and the other served carrots (62% ate it). Lastly, on day three one school served apples (80% ate it) and the other served grapes (85% ate it). It is now possible to give an accurate interpretation of the average daily FV intake shown in Table 3. The average fruit intake at morning snack for intervention students was 0.441. Despite fewer fruit items served as free snacks, this slight increase from post-test 1 is largely because none of the fruit was tainted (recall papaya). In contrast, fruit intake among control students decreased slightly (0.053 < 0.074). The average vegetable intake for intervention students was higher than post-test 1 (0.218 > 0.07). This was the result of both schools serving a free a vegetable snack (cucumber, carrots) rather than just one school offering cauliflower on one day. Once again, control students ate essentially zero vegetables for morning snack. Overall, average daily FV intake between post-test 1 and post-test 2 was nearly constant for control students, however intervention students ate more FV on post-test 2. This increase in FV consumption is more a result of increased FV options available during morning snack than an increased program effect. Based on this analysis, the FFVP increased FV intake among intervention students compared to control students. This positive impact was present after just two months of program implementation, however the magnitude of this effect did not grow even after the program was in place for six months. Moreover, the reach of the FFVP is limited to the morning snack when they are given free FV through the program. This suggests that increasing access to FV by serving a free snack at school can be successful in increasing FV intake among children. Comparing Baseline Fruit and Vegetable (FV) Intake Table 1 compares the baseline average daily FV intake for intervention and control students. The following examples will help with interpreting the numbers in this table. Suppose every student ate one fruit item for breakfast at home on one of the three days and ate no fruit on the other two days. Then the average fruit intake for breakfast at home would be 0.333 (the first row of Table 1). Alternatively, if half of the students ate one fruit item for breakfast at home on two out of the three days and the other half ate no fruit items on any of the three days then that cell would also be 0.333. Given these examples there is not one single interpretation of these numbers, but rather it is more useful to consider these numbers as relatively small or large. For example, a value of 0.05suggests that on average one in twenty students ate a fruit item each day during that time period. The data also informs us about how many FV students were eating each day as well as when students were eating the most FV. The pattern of FV intake was nearly identical with very few statistically significant differences across groups. All students ate very few fruits and even fewer vegetables throughout the morning. Control students did however report eating more fruit for breakfast at school than intervention students, but this difference was small. Overall, control students (1.81) ate more FV than intervention students (1.56), but this difference was almost entirely due to the FV items offered for school lunch on the survey days. The school lunch typically offers 2-3 FV items each day, but on any particular day this can vary from school to school. The average number of FV items offered for lunch in the intervention schools on the three survey days was 1.50 and 1.00 respectively (2.50 total). In comparison, the average number of fruit items offered in control schools was lower at 1.00, while the average number of vegetables was higher at 1.75 (2.75 total). This difference in lunch menus resulted in higher fruit intake (0.688 > 0.497), but lower vegetable intake (0.242 < 0.600) for intervention students at lunch. Similarly, intervention students ate less fruits and vegetables overall (1.56 < 1.81) due to fewer FV lunch options. About 60% of the average daily FV intake among all students was from lunch at school. For intervention students this amounted to 0.688 + 0.242 = 0.930 which is 59.6% of their average daily FV intake of 1.56. Similarly, for control school students this amounted to 0.497 + 0.600 = 1.10 which is 60.6% of their average daily FV intake of 1.81. In sum, most students do not meet the recommended USDA guidelines for FV consumption of 5-9 items a day. For many students the school lunch was the main source of their daily FV consumption. This highlights the importance of increasing access to FV in the school setting as a way to increase FV consumption among children. Because this is exactly what the FFVP was designed to do, researchers next examined how successful the program was in achieving this goal. Conclusion & Future Research The results presented here are quite significant in the context of child health and nutrition. Quite simply, the FFVP works! Our research suggests that the FFVP has had some beneficial short term effects. Specifically, the FFVP has increased the FV intake of participating students by providing free access to a variety of FV as a morning snack. If students are given free FV in a setting with few alternative options they will eat them. Despite this positive program effect, the reach of the FFVP was limited to the morning snack when students were served free FV through the program. Data from post-test 1 and post-test 2 surveys showed no evidence that participating in the FFVP influenced children to eat more FV outside of school for breakfast, after-school snack, dinner, or night-time snack. Perhaps most disappointing was that the FFVP did not lead students to bring FV items from home on days when their school did not provide a free FV snack through the program. This suggests that increasing access to FV at school can be successful in increasing FV intake among children, however there are limitations. Therefore, future research should examine how to expand the reach of the program beyond the access to free FV provided as snacks in the classroom. We are currently analyzing additional data from a FV coupon experiment undertaken as part of our 2008-09 program evaluation using the same two intervention schools from the research presented here. We are also collecting detailed data from a new intervention school for our evaluation of the 2009-10 FFVP. This research involves providing students with incentives and reminders in an effort to influence their FV snack behavior. Both of these additional research projects are described in more detail in a second poster titled, Expanding the Influence of the USDA Fresh Fruit & Vegetable Program: Examining the Effectiveness of Incentives and Reminders to Increase Fruit and Vegetable Intake Among Wisconsin Elementary School Students. References & Acknowledgements 1. Edmunds, L. D., and S. Ziebland. Development and Validation of the Day in the Life Questionnaire as a Measure of Fruit and Vegetable Questionnaire for 7-9 Year Olds, Health Education Research: Theory & Practice, 2002, v.17, n.2, pp.211-220. 2. Story M, Mays RW, Bishop DB, Perry CL, Taylor G, Smyth M, Gray C. 5-a-Day Power Plus: Process Evaluation of a Multi-component Elementary School Program to Increase Fruit and Vegetable Consumption. Health Education & Behavior. 2000; 27:187-222. *We gratefully acknowledge funding support from the UW Eau Claire Office of Research & Sponsored Programs, Differential Tuition as well as Xcel Energy of Eau Claire and Northwestern Bank of Chippewa Falls.


