8563A
8563A. SPECTRUM ANALYZER 9 kHz - 26.5 GHz. Overview What is Spectrum Analysis?. Overview Types of Tests Made. Modulation. Noise. Distortion. Theory of Operation Spectrum Analyzer Block Diagram. RF input attenuator. IF gain. IF filter. detector. mixer. Input signal. Log Amp.

8563A
E N D
Presentation Transcript
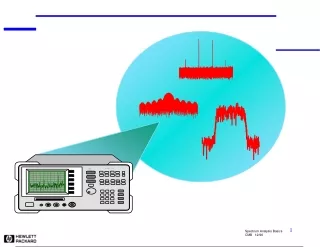
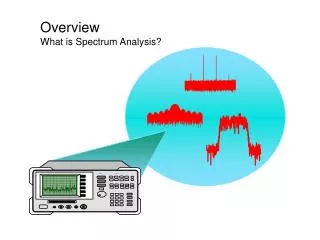
8563A SPECTRUM ANALYZER 9 kHz - 26.5 GHz Overview What is Spectrum Analysis?
Overview Types of Tests Made . Modulation Noise Distortion
Theory of Operation Spectrum Analyzer Block Diagram RF input attenuator IF gain IF filter detector mixer Input signal Log Amp Pre-Selector Or Low Pass Filter video filter local oscillator sweep generator Crystal Reference CRT display
Frequency Translated Signals Resultant Signal To Be Measured Mixer Generated Distortion Specifications Distortion Mixers Generate Distortion
3 dB Detector Mixer 3 dB BW Input Spectrum IF Filter/ Resolution Bandwidth Filter (RBW) LO Sweep RBW Display
Primary functions (Frequency, Amplitude, Span) Softkeys 8563A SPECTRUM ANALYZER 9 kHz - 26.5 GHz Control functions (RBW, sweep time, VBW) Numeric keypad RF Input
Penalty For Sweeping Too Fast Is An Uncalibrated Display Swept too fast
Specifications Sensitivity/DANL Effective Level of Displayed Noise is a Function of RF Input Attenuation signal level 10 dB Attenuation = 20 dB Attenuation = 10 dB Signal-To-Noise Ratio Decreases as RF Input Attenuation is Increased
10 dB 10 dB Specifications Sensitivity/DANL: IF Filter (RBW) Displayed Noise is a Function of IF Filter Bandwidth 100 kHz RBW 10 kHz RBW 1 kHz RBW Decreased BW = Decreased Noise
Specifications Sensitivity/DANL Sensitivity is the Smallest Signal That Can Be Measured 2.2 dB Signal Equals Noise
Specifications Dynamic Range Dynamic Range
Features Modulation Measurements: Time-Gating Time Division Multiple Access (TDMA) user #1 Time 1 0 Amplitude 5 4 Timeslot 3 2 1 0 1 2 3 4 5 6 Frequency Channel Number