Download
1 / 30
300 likes | 410 Vues
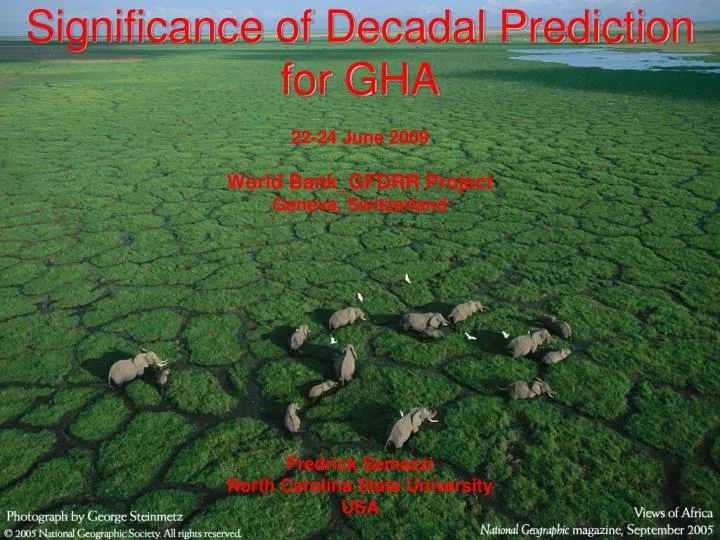
Significance of Decadal Prediction for GHA 22-24 June 2009 World Bank_GFDRR Project Geneva, Switzerland Fredrick Semazzi North Carolina State University USA. Focus.

E N D
Significance of Decadal Prediction for GHA22-24 June 2009World Bank_GFDRR ProjectGeneva, SwitzerlandFredrick SemazziNorth Carolina State UniversityUSA
Focus Challenge of providing predicted decadal climate variability & climate change information at spatial scales appropriate for end-users
Improved Surface Temperature Prediction for the Coming Decade from a Global Climate ModelDoug M. Smith,* Stephen Cusack, Andrew W. Colman, Chris K. Folland, Glen R. Harris, James M. Murphy • Previous climate model projections of climate change accounted for external forcing from natural and anthropogenic sources but did not attempt to predict internally generated natural variability. • Smith et a 2007 present a new modeling system that predicts both internal variability and externally forced changes & hence forecasts surface temperature with substantially improved skill throughout a decade, both globally and in many regions. • This system predicts that internal variability will partially offset the anthropogenic global warming signal for the next few years. • However, climate will continue to warm, with at least half of the years after 2009 predicted to exceed the warmest year currently on record.
GFDRR Goal#1Regional climate trends and the adequacy of global and regional climate observations for adaptation purposes
Eastern Africa Decadal Dipole Mode-based on CMAP 2.5 degree resolution + + - -
Eastern Africa Decadal Dipole Mode-based on CMAP 2.5 degree resolution
Eastern Africa Decadal Dipole Mode(based on NASA satellite data) Increasing Rainfall Largest drying signal over land is over Eastern Africa Esp. Serengeti Masai-Mara Corridor Decreasing Rainfall + - http://earthobservatory.nasa.gov/Newsroom/NewImages/images.php3?img_id=17761
IPCC GCM Projections Decadal Dipole Mode: Is it a fingerprint of climate change over Eastern Africa
INFORMATION REQUIRED AT DISTRICT SCALEAverage Annual Total Rainfall (mm)(Based on Willmott Climate Dataset) arid Turkana District (arid) Wajir District (arid) Garissa District (arid) Kitui District (semi-arid) Narok District (semi-arid) 500 500 500 1200 1200 • The analysis of the data provides important information atdistrict levelabout spatial distribution and amount of rainfall which is necessary for planning climate sensitive social-economic activities • Makes distinction between arid and semi-arid climatic conditions over Kenya Semi-arid
Climate Data Over the arid and semi-arid regions rain-gauge data coverage is very marginal Monitoring over these regions need to be upgraded
Present Climate Data Quality is Acceptable for Social-Economic Planning at District Level but Inherent Data Uncertainties are a Limiting Factor and Need to be Reduced Turkana District (arid) Wajir District (arid) Garissa District (arid) Kitui District (semi-arid) Narok District (semi-arid) 500 500 Willmott Climatology 500 1200 1200 Turkana District (arid) Wajir District (arid) Garissa District (arid) Kitui District (semi-arid) Narok District (semi-arid) 50 50 Willmott - CRU Potential Errors 50 100 50
Short Rains Onset/Withdraw one rain season Highly erratic one rain season
Examples of Applications • Tourism(Serengeti National Park) • Hydroelectric power generation Owen Falls Dam at source of River Nile - Navigation Safety over Lake Victoria
Masai Mara-Serengeti Climate Anomalies Impacts on Wildebeest Migration Masai Mara-Serengeti (2005 Drought) Assessment shows that very late start of the rains was responsible for the 2005 disaster Analysis also clearly detects the severe 1998-1999 drought
Serengeti Masai-Mara Wildebeest Migration Route and Timing is dependent on Climatic Conditions Best Time for Tourists to see Migration is the Crossing of Grumeti River in Western Serengeti Park/Tanzania or Crossing of Mara River into Masai Mara National Park/Kenya [http://www.safarimappers.com/serengeti-migration.aspx January February March April March June July August September October November December
Masai Mara-Serengeti Climate Anomalies Impacts on Wildebeest Migration & Tourism Industry in Kenya • Late start of the 2005 was the primary reason for the failure of the rains over Masai Mara-Serengeti rather than early withdraw • This is region has a clear trend due to the climate change fingerprint signal; Further increased delay of 2 weeks in the start of the rains in Kenya, which is good possibility in the next 10 years, would adversely disrupt/shift the timing of the wildebeestmigration cycle • For example a two week delay in the start of the rains would put the location of the wildebeestherds deep into Tanzania. Kenya bound tourist using the climatic migration calendar would miss the extravaganza altogether (see schematic for migration route) • Although it cannot be asserted that a collapse of this world-famous ecosystem is imminent based on this assessment, the climate stress could eventually undermine it beyond point of no return • Therefore baseline characterization of the local climate is important for wildlife monitoring, and in the face of climate change, accurate projections are critical to assess the fate of the future of the tourism industry in Kenya that depend on this region.
Naroc district (Masai Mara-Serengeti) impacts example Climate Anomalies Impacts on Wildebeest Migration & Tourism Industry in Kenya • The late start of the rain season was the primary reason for the catastrophic failure of the rains over Masai Mara-Serengeti in 2005. • Apparently once there is a significant delay in the start of the rainfall onset the chances of recovery back to normal seasonal rainfall is very unlikely. • In the Masai-Mara Park tourism the movement of the rain belt is a fundamental driver of the migration of wildlife because it dictates the growth of seasonal vegetation cover. • The onset of the rains around March triggers the migration of the Wildebeest population from Kenya Masai-Mara into Serengeti in Tanzania. • A recent study (Douglas E. Musiega1, Sanga-Ngoie Kazadi, 2006) has shown that dry season migration routes tend toward areas with better vegetation activity, i.e., those characterized by higher NDVI gradients. • During the western trek, wetter dry seasons have the effect of delaying the wildlife movement northwestward. • However the variation in rainfall conditions during the rainy and dry season has no significant influence on the southern trek route location because movement is dictated by hardship of the terrain rather vegetation which is abundant • During the northern trek, wetter dry seasons have the effect of delaying the tendency to move westward • Therefore baseline characterization of the local climate is important for herds monitoring and performance of the tourism industry in Kenya, and in the face of climate change, accurate projections will be critical • It will be critical to monitor the relationship between the dipole mode (possible finger print of climate change) and the migration patterns as this could result in major shifts of migration patterns.
GFDRR Goal#2: assess the adequacy and reliability of available model-based climate projections for adaptation needs
Rainfall Projections (A2: 2071-2100 average) minus (RF: 1961-1990 average)Oct-Dec Short Rains Rainfall projections (A2: 2071-2100 average) minus (RF: 1961-1990 average) for the Oct-Dec short rains: (left) RegCM3 (40 km grid); (centre) 2-member FvGCM ensemble average; (right) eight IPCC GCM super ensemble average. Units, mm. General agreement among, 40km resolution RCM, high resolution (approx 1 deg) GCM, and coarse resolution(>2 deg) IPCC GCM ensemble; however differences are critical for some end users
GFDRR Goal#3: provide qualified indications of expected climate change for assistance in developing effective adaptation and climate risk management strategies
Spatial Scales Over Lake Victoria Basin for Hydro-E & Tourism Require models that are not only of high resolution but also support the physics responsible for the critical mechanisms
Lake Victoria Basin Climate VariabilityAlgorithm for (making lake level projections)
Current & Projected Levels of Lake Victoria (left) Lake Victoria observed levels (blue) compared to estimates based on our modified version of Tate et al (2004) water balance model for Lake Victoria with observed rainfall from six rain gauge stations (red); (center) Lake Victoria observed levels (blue) compared to estimates based on our modified version of Tate et al (2004) water balance model for Lake Victoria with rainfall from RegCM3-20km resolution reference run (red); (right) lake levels projections (2071-2100) based on rainfall input from RegCM3 (20km grid) A2 simulation. Since the initial level of the lake for 2071 is unknown, we assume multiple initial conditions for the hydrological model. All initial states converge to the same projection curve after about 10 years.
Comparison of Raingauge Variability at Musoma & Bukoba Located on Opposite Sides LV Requires Uncoupled Models Figure shows a surprising complete reversal in the observed decadal-scale rainfall oscillation at two locations on opposite shores of Lake Victoria. We believe that such a dramatic switch occurring over such a short distance O(200km) across Lake Victoria is in response to a common underlying regional climate anomaly regime. This is compelling testimony of the need for application of higher resolution regional climate models compared to GCMs which cannot resolve the salient characteristics of such an important source of livelihood, for water and hydroelectric power, for over 300 million inhabitants of LVB and the River Nile Basin.
Navigation Safety over Lake VictoriaA new East African Community Program
STRENGTHENING METEOROLOGICAL SERVICES ON LAKE VICTORIA TO ENHANCE SAFETY OF NAVIGATION AND EFFICIENT EXPLOITATION OF NATURAL RESOURCES RegGCM3-POM simulation in December 1988 average over Lake Victoria. (a) 850mb wind at 6UT, and (b) lake surface temperature Requires full hydrodynamics of Lake Victoria
Summary • Data resolution is a major problem. The 0.5 degree resolution seems to be the minimum threshold acceptable for district scale assessment. Station data is not the solution at this time because the coverage over the semi-arid districts is very poor. • Present climate data quality is acceptable for social-economic planning at district level & Inherent data uncertainties are a limiting factor and need to be reduced by improved monitoring of baseline climate • Over the arid and semi-arid regions rain-gauge data coverage is very marginal & monitoring over these regions need to be upgraded • Currently model-based climate information is available at regional scales & incompatible for broad range of end users • Information about intraseasonal time scales is important for applications such as wildlife management, such onset & withdraw of the rains • Require models that are not only high resolution but also support the physics of the critical mechanisms; require full hydrodynamics of Lake Victoria for a vriety of important applications such as, fisheries, pollution, hydroelectric power generation & marine navigation safety