AMSR-E Ocean Rainfall Algorithm Status
AMSR-E Ocean Rainfall Algorithm Status. C. Kummerow Colorado State University. AMSR-E Science Team Meeting Huntsville, AL 2-3 June, 2010. Cloud Resolving Model Database. TRMM PR/TMI & Model Database. Bayesian Inversion. TB model #1. TB observed. TB model #2. TB model #3. ~10 km.


AMSR-E Ocean Rainfall Algorithm Status
E N D
Presentation Transcript
AMSR-E Ocean RainfallAlgorithm Status C. KummerowColorado State University AMSR-E Science Team Meeting Huntsville, AL 2-3 June, 2010
Cloud Resolving Model Database TRMM PR/TMI & Model Database Bayesian Inversion TB model #1 TB observed TB model #2 TB model #3 ~10 km GPROF_2008
GPROF2008 Algorithm (Ocean) Create Geophysical Data Base (TRMM) Start with non-raining background (1-D Var or OE) Add observed PR rain profiles to non-raining background Compute Tb at TMI channels and resolution and compare to observations Adjust rain profiles to be consistent with PR and TMI Create Rainfall/Tb Data Base (AMSR-E) Use adjusted 4 km rain and non-raining profiles to compute Tb for AMSR-E Create Database (raining and non-raining) pixels in 1K SST and 2 mm TPW bins. Cluster profiles in each SST/TPW bin to 1000 self-similar Tbs for computational efficiency Run Retrieval Determine SST (Reynolds) & TPW (Sensor) Compare observed Tb to dbase entries within ±1K (SST) and ±2 mm (TPW) Weight profiles [observed difference vs uncertainty in channel from dbase]
Cloud profile database is partitioned into separate SST and TPW bins
Rain is added below threshold of PR and DSD assumption in PR is modified Tb differences after adding rain below PR threshold Tb differences after DSD modification Original Tb differences Net change is a 2% increase from PR. Biggest change in colder SST with high TPW
Tb from Background and Radar rain structure Optimal combined retrieval would leave all points on the 1:1 line
Database Preparation Steps • All pixels - raining and non-raining are retained for database (11,000,000 per month. Up to 32,000 in each SST/TPW bin) • For retrieval to run, all entries in SST and TPW bin are clustered based upon similar Sfc rainfall and Tb1-9. Use 1000 clusters for raining and 200 for non-raining. Numbers based on trial and error. Seek fewest clusters with no change ( < 1%) in final retrieval. • To account for colder environments (e.g. AMSR-E, SSMI), SST and TPW from existing profiles are reduced artificially by lowering SST while removing lowest layer of atmosphere corresponding to 6°/km. GPM will solve properly.
GPROF 2008 GPROF2008 continues to be a Bayesian algorithm consisting of: P(R|Tb) = P(Tb|R)•P(R)/P(Tb) Pixels are classified only by background SST and TPW. Database entries within ±1K in SST and ±2 mm in TPW are searched for potential solutions. Error covariances are established from fit between observed and simulated Tb in the a-priori database. No more rain screens. All pixels are compared to database. Bayes’ theorem determines rain or no rain. Consequence: almost all pixels have a very small probability of rain. No more convective/stratiform separation. Only necessary because CRM database was skewed to convective pixels. Entire code is now exceedingly simple.
Hurricane Floyd September 13, 1999 GPROF 2008 GPROF 2008 + TRMM radar GPROF 2008 example
Hurricane Floyd Sep 3, 1999 TMI Algorithm Comparison 0.25 x 0.25 gridded GPROF2008 1.28 mm/day RSS 0.96 mm/day GSmap 0.99 mm/day
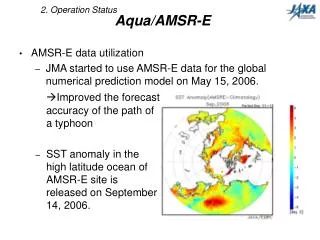
TMI / AME TPW Coincident Overpass February, 8th, 2007
GPROF 2008 Processing Algorithm Pre-Processors Ancillary Info Sensor Data TMI_L1C TMI_1B11 AME_L1C AME_L2A SSMI_L1C SST directory spec Ancillary dir spec Sat, Sensor Info Channel Freqs, Errs Profile dbase names Spacecraft position Pixel Location Pixel Time, Tbs, EIA GPROF08 input file Ancillary Datasets Profile Databases Elevation Land masks Sea Surface Temp Clustered Profiles Land - All Coast – SSM/I Ocean - Each Sensor GPROF2008 Input Data Native Binary Output Temporary Files Programs Output Files HDF HDF-EOS NetCDF Format Converter*
• Basic Diagnostics PixelStatus QualityFlag OceanSearchRadius ChiSquared • Surface Precipitation Surface Precipitation Surface Rain Convective Fraction • Precipitation Structure Profile number [1-100] per hydrometeor type and freezing level • Probability of Precipitation Probability of Precipitation Output from GPROF 2008