Download
1 / 1
10 likes | 179 Vues
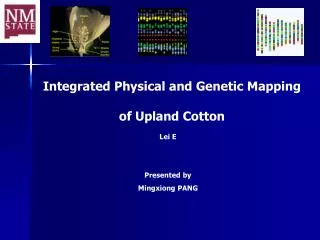
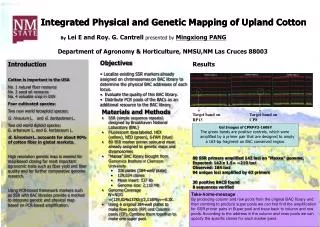
Target band on RP13. Target band on CP8. Integrated Physical and Genetic Mapping of Upland Cotton. Integrated Physical and Genetic Mapping of Upland Cotton. By Lei E and Roy. G. Cantrell presented by Mingxiong PANG. Department of Agronomy & Horticulture, NMSU ,NM Las Cruces 88003.

E N D
Target band on RP13 Target band on CP8 Integrated Physical and Genetic Mapping of Upland Cotton Integrated Physical and Genetic Mapping of Upland Cotton By Lei E and Roy. G. Cantrell presented byMingxiong PANG Department of Agronomy & Horticulture, NMSU,NMLas Cruces 88003 • Objectives • Localize existing SSRmarkers already assigned on chromosomes on BAC library to determine the physical BAC addresses of each locus. • Evaluate the quality of this BAC library. • Distribute PCR pools of the BACs as an additional resource to the BAC library Introduction Cotton is important in the USA No. 1 natural fiber resource No. 2 seed oil resource No. 4 valuable crop in USA Four cultivated species: Two new world tetraploid species: G. hirsutumL. and G. barbadense L. Two old world diploid species: G. arboreum L. and G. herbaceum L. G. hirsutumL. accounts for about 90% of cotton fiber in global markets. High resolution genetic map is needed for map-based cloning for most important agronomic traits such as fiber yield and fiber quality and for further comparative genome research. Using PCR-based framework markers such as SSR with BAC libraries provide a method to integrate genetic and physical map based on PCR-based amplification. Results • Materials and Methods • SSR (simple sequence repeats) designed by Brookhaven National Laboratory (BNL) • Fluorescent dyes labeled. HEX (yellow), NED (green), 6-FAM (blue) • 80 SSR marker primer pairs and most already assigned to genetic maps and chromosomes • “Maxxa” BAC library brought from Genomics Instituteat Clemson University • 336 plates (384-well/ plate) • 129,024 clones • Mean insert: 137 kb • Genome size: 2,118 Mb • Genome Coverage • W=NI/G =(129,024х137Kb)/2,118Mb=~8.3X. • Using 6 original 384-well plates to make Row pools (RP) and Column pools (CP). Combine them together to make one super pool. Gel Images of CPRP#3-1606Y The green bands are positive controls, which were amplified by a primer pair that are designed to amply a 163-bp fragment on BAC conserved region. 80 SSR primers amplified 142 loci on “Maxxa” genome. Expected: 142 х 1.5= ~210 loci Observed: 184 loci 94 unique loci amplified by 63 primers 30 positive BACS found 8 sequences verified Take-home-message By producing column and row pools from the original BAC library and then combing to produce super pools we can first find the amplification for SSR primer pairs in Super pool and trace back to column and row pools. According to the address in the column and rows pools we can specify the specific clones for each marker pairs.