Chapter 1: Measurement and Uncertainty
320 likes | 349 Vues
Understand core principles, including SI units and significant figures, for precise measurements in physics. Explore the importance of measurement language for global collaboration. Enhance skills in error estimation and unit conversions.

Chapter 1: Measurement and Uncertainty
E N D
Presentation Transcript
Chapter 1: Measurement and Uncertainty Section 1: Observation, Describing quantities, and Estimation Section 2: Measurement uncertainty, Error propagation, and Analytical methods
Section 1 Objectives Core Principles • Physics and Observation • Fundamental and derived SI units • Scientific notation and metric multipliers • Significant figures • Orders of magnitude • Estimation • Applications and skills: • Using SI units in the correct format for all required measurements, final answers to calculations and presentation of raw and processed data • Using scientific notation and metric multipliers • Quoting and comparing ratios, values and approximations to the nearest order of magnitude • Estimating quantities to an appropriate number of significant figures
ToK and Aims Theory of knowledge: What has influenced the common language used in science? To what extent does having a common standard approach to measurement facilitate the sharing of knowledge in physics? Utilization: This topic is able to be integrated into any topic taught at the start of the course and is important to all topics Students studying more than one group 4 subject will be able to use these skills across all subjects Aims: Aim 2 and 3: this is an essential area of knowledge that allows scientists to collaborate across the globe Aim 4 and 5: a common approach to expressing results of analysis, evaluation and synthesis of scientific information enables greater sharing and collaboration
What is Physics? Science Physics Physics may be generally described as the study of forces and energy, and matter’s reaction to these in space and time. • Science is the attempt to understand and describe the universe. (Physics ≈ Grammar, Math ≈ Language).
Fundamental Forces in Physics 4 Forces Strongest to Weakest Strong Nuclear Force Electromagnetic Weak Nuclear Force Gravity
Observation and Measurement • Common terminology: Since the 18th century, scientists have sought to establish common systems of measurements to facilitate international collaboration across science disciplines and ensure replication and comparability of experiments. • Definition of physical quantities. Physics must carefully define the various aspects of the universe we wish to quantify. Then we need units or standards by which to measure these quantities. There are seven fundamental quantities for which we have standard units: • Mass measured in kilograms (kg)—defines the amount of matter or inertial quantity of matter. • Length measured in meters (m)—defines the space in which some event occurs or the distance/size of some object/space • Time measured in seconds (s)—defines the duration over which an event takes place • Temperature measured in Kelvin degrees (K)—defines the average kinetic energy of the molecules of a substance • Electric Charge measured in Coulombs (C)—defines the amount of electric charge a particle or object possesses • Luminosity measured in Candelas (cd)—defines the relative brightness of an object • Amount of substance measured in moles (mol)—defines how many atoms of a substance exist for a given material • Derived Units: Any unit created by algebraic combinations of these fundamental units creates a derived unit. Ex velocity = distance/time (m/s) • Certainty: Although scientists are perceived as working towards finding “exact” answers, there is unavoidable uncertainty in any measurement. No measurement is infinitely precise therefore all quantities have error associated with them. Essential idea: • Since 1948, the Système International d’Unités (SI) has been used as the preferred language of science and technology across the globe and reflects current best measurement practice.
Dimensional Analysis • By analyzing the algebra performed to generate a quantity and comparing the known unit for the quantity to the units obtained by that algebra we can confirm the correctness of our equations. • Note: IB standard for metric units is to place all units in the numerator and to use negative exponents, rather than the fractional notation. Examples of both are provided below. Ex: force has units of kgms-2 (or ) then if we have an equation is this the correct equation for calculating force? Ex: Suppose the rate of a car is 12m/s, and it travels for 5 seconds. What is the distance traveled in that time by the car? (note that rate refers to velocity in ms-1) PRACTICE: Decide if the formulas are dimensionally consistent. The information you need is that v is measured in m/s, a is in m/s2, x is in m and t is in s. (a) v = at2 (b) v2 = 3ax (c) x = at2
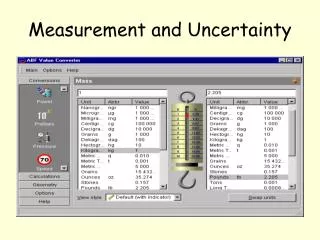
Unit Conversions and Powers of 10 • Since the United States (and England) use a different set of units for their measurement systems it is frequently necessary to convert between these units and the metric system. It is also necessary to perform unit conversions between different units when they are expressed in very large or very small units of time. • Particularly, time is measured as base seconds but 1min=60seconds and 1hr=60mins and 1day=24hrs and 1year=365days, etc. Then make the following conversion: Ex: how many minutes are in 1 year? Ex: how many seconds are in the average human lifespan? (approx. 75yrs) • Physics encompasses a vast range of values though. Distances on earth are commonly measured using meters or, at most, units which consist of 1000m, the kilometer. In space however, distances are so large (the distance between stars for example) that it is near meaningless to use meters to describe these distances so the distance light travels in a year the lightyear is used instead. Ex: If light moves at 3(108)ms-1 calculate how many meters are in 1 lightyear (ly). • In order to make writing and working with these numbers more efficient a base 10 prefix system has been developed to make writing and converting between units more concise. Each prefix is an abbreviation for a power of 10 multiplier.
Prefix System Ex: 9,000,000m = 9(106)m = 9Mm Ex: 0.000000136s = 1.36(10-7)s = 1.36(10-6)(10-1)s=.136µs OR 0.000000136s = 1.36(10-7)s = 1.36(10-9)(102)s = 136(10-9)s = 136ns Memorize this table! You will be responsible for these prefixes on quizzes and exams. Then we can convert between these prefixes by division and multiplication by powers of 10. Ex: Convert 25mm into cm. Ex: Convert 2Gbytes into kbytes Homework Question: Why is the base unit for mass referred to as the kilogram, instead of the gram and what problems does this introduce? Be prepared to answer for a bellwork quiz. Power of 10 Prefix Name Symbol 10 -12pico p 10 -9nano n 10 -6 micro µ 10 -3millim 10 -2centi c 10 3 kilo k 10 6 mega M 10 9giga G 10 12teraT
Scientific Notation • Given the very large and very small values in physics it is also useful to represent numbers as their significant figures multiplied by their powers of 10. • This practice greatly helps to keep track of significant figures throughout a calculation and makes the mathematics easier for working with extremely large and small quantities in a problem. • Form: A(10B) where A is some number coefficient with a certain number of significant figures and B is an integer. • Note, do not write your scientific notation using Ax10B. Ex: Put the number 345,000,000mol into scientific notation, then use the proper prefix. Ex: Put the number 100400m into scientific notation, then use the proper prefix.
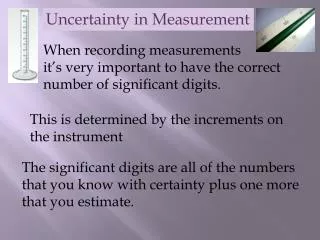
1 cm 0 1 Significant Figures and Measuring Devices • Error in measurement is expected because of the imperfect nature of our measuring devices. • Significant figures are the reasonable number of digits that a measurement or calculation should have. • Ex: A typical meter stick has marks at every millimeter (10 -3 m or 1/1000 m). Thus the best measurement you can get from a typical meter stick is to the nearest mm. • Such is always true of analog devices or devices whose measurements depend on a physical observation or marking which is manually read. • A digital measuring device, on the other hand, is only “good” to the least significant digit’s place. How long is this line? What precision do we have using this scale? Then how many significant figures can our measurement have? What is the number of significant figures on this digital multimeter?
Orders of Magnitude and Estimation • As previously discussed there is tremendous difference in the size of quantities observed in the universe. Mass of universe 1050 kg Diameter of universe 1025 m Diameter of galaxy 1021 m Planck Length 10-35 m Speed of light 108 ms-1 Diameter of atom 10-10 m Diameter of nucleus 10-15 m Diameter of quark 10-18 m Mass of proton 10-27 kg Mass of quark 10-30 kg Mass of electron 10-31 kg Ex: Given that the smallest length in the universe is the Planck length of 10-35 meters and that the fastest speed in the universe is that of light at 108 meters per second, find the smallest time interval in the universe. Ex: Find the difference in order of magnitude of the mass of the universe to the mass of a quark. Ex: For nuclear diameter 10-15 and atomic diameter 10-10 answer the following:
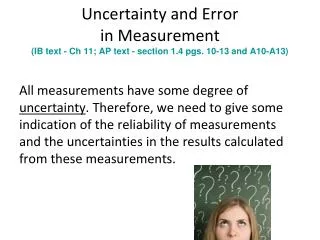
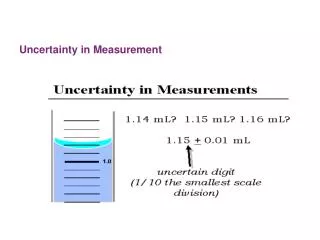
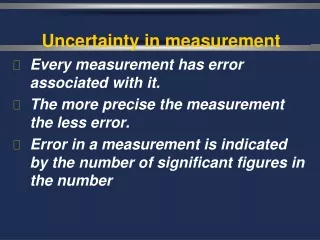
Uncertainty in Measurement • Scientists aim towards designing experiments that can give a “true value” from their measurements, but due to the limited precision in measuring devices, they often quote their results with some form of uncertainty. • Uncertainties: “All scientific knowledge is uncertain. When the scientist tells you he does not know the answer, he is an ignorant man. When he tells you he has a hunch about how it is going to work, he is uncertain about it. When he is pretty sure of how it is going to work, he still is in some doubt. And it is of paramount importance, in order to make progress, that we recognize this ignorance and this doubt. Because we have the doubt, we then propose looking in new directions for new ideas.” – Feynman, Richard P. 1998. The Meaning of It All: Thoughts of a Citizen-Scientist. Reading, Massachusetts, USA. Perseus. P 13. • “One aim of the physical sciences has been to give an exact picture of the material world. One achievement of physics in the twentieth century has been to prove that this aim is unattainable.” – Jacob Bronowski
ToK and Aims Theory of knowledge:To what extent can we, as scientists and individuals, ever be certain? Utilization: • Students studying more than one group 4 subject will be able to use these skills across all subjects Aims: • Aim 4: it is important that students see scientific errors and uncertainties not only as the range of possible answers but as an integral part of the scientific process • Aim 9: the process of using uncertainties in classical physics can be compared to the view of uncertainties in modern (and particularly quantum) physics
Section 2 Objectives Core Principles • Random and systematic errors • Absolute, fractional and percentage uncertainties • Error bars • Uncertainty of gradients and intercepts Applications and skills: • Explaining how random and systematic errors can be identified and reduced • Collecting data that include absolute and/or fractional uncertainties and stating these as an uncertainty range (expressed as: best estimate ± uncertainty range) • Propagating uncertainties through calculations involving addition, subtraction, multiplication, division and raising to a power • Determining the uncertainty in gradients and intercepts
Data Book References Note: Analysis of uncertainties will not be expected for trigonometric or logarithmic functions in examinations Data booklet reference: (grow comfortable using these data booklets for quick reference, you will have to use them during the IB exam) If y = a b then y = a + b If y = a ·b /c then y / y = a / a + b / b + c / c If y = a n then y / y = | n · a / a |
0 1 Good Uncertainty Example • Ex: Suppose Bob measures L = 11 mm 1 mm and Ann measures L = 12 mm 1 mm with the ruler below. Because we use a measuring device with a least increment of 1mm or 10-3m, we say the precision or uncertainty in our measurement is 1 mm. • Then Bob guarantees that the line falls between 10 mm and 12 mm. • Ann guarantees it is between 11 mm and 13 mm. • Both are absolutely correct.
Bad Uncertainty Example • SOLUTION GIVEN: • 6.2 is the nearest reading. • The uncertainty is certainly less than 0.5. Problems: What is wrong with this?
Types of Error Random Systematic Systematic error originates from a baseline or calibration error. Often due to experimental set up or measurement device offset. More difficult to observe unless the observer has a very good model or verified data to compare results. Graphically can be observed in a consistently higher or lower trend line than your model function. Systematic error can be corrected for by using data normalization techniques • Random error originates from imprecision of measurement and observation of measurement • Compounded by rapidly fluctuating systems. • Most commonly observed error in data. • Random error is visualized by the error bars of a scatter plot. • Minimized by making repeated measures to find an average and its standard deviation.
Precision v. Accuracy Accurate Precise Refers to the closeness of the experimental data to other data points within the sample. • Refers to the closeness of the data/result to the expected true value. Ex: Dart board. The objective is to throw 5 darts and hit a bullseye. The results of 4 rounds are plotted below, discuss the accuracy v. precision of each round and then relate to random v. systematic error. Trial 3 Trial 2 Trial 1 Trial 4
Representing Uncertainty/Error • 3 main ways: Absolute uncertainty, fractional uncertainty, and percentage uncertainty • Absolute error is the raw uncertainty or precision of your measurement. Ex: 15cm ± 2cm; 2cm is the absolute uncertainty. The expected true value of the measurement could be anywhere from13 to 17cm. If you are provided no knowledge of your instrument but only some experimental data values you can determine the raw error by taking the range of the data (the largest value –the smallest value)/2 . • Fractional error is the ratio of the absolute or raw error to the measurement. Ex: 15cm ± 2cm is the absolute error, then is the fractional uncertainty. • Percent error is the fractional uncertainty represented as a percentage of the measurement. Ex: 15cm ± 2cm is the raw error, is the fractional error, then is the percent uncertainty ToK Question: why is the percent error useful compared to the other two?
Error Propagation Calculations • Error never decreases in a system. When a formula involving arithmetic operations occurs on values with error that error will increase through the operation in a way described by the following formulas: If y = a b then y = a + b If y = a ·b /c then y / y = a / a + b / b + c / c If y = a n then y / y = | n · a / a | To find the uncertainty in a sum or difference you just add the uncertainties of all the ingredients. To find the uncertainty in a product or quotient you just add the percentage or fractional uncertainties of all the ingredients. Remember that exponents are merely a concise form of multiplication then your formula is also a concise version of the product uncertainty formula. Ex: If A=3.5±0.5m; B=6.2±0.6m; C=10.1±1.5m; D=5.5±0.2m, calculate the resulting value including uncertainty in raw, fractional, and percent forms for the resulting value using the formula provided above. • A+B-C • C∙D÷B • A3 • B-A∙C2
More Practice A 9.51 0.15 meter rope ladder is hung from a roof that is 12.56 0.07 meters above the ground. How far is the bottom of the ladder from the ground? A car travels 64.7 0.5 meters in 8.65 0.05 seconds. What is its speed?
Analytical Methods for Data Experimental rigor: • IB has a requirement that when you conduct an experiment of your own design, you must have fivevariations in your independent variable. • And for each variation of your independent variable you must conduct three trials to gather the values of the dependent variable. The three values for each dependent variable will then be averaged. • Note that if you need to employ statistical analysis on data such as standard deviation you must use no fewer than five trials and for using data comparisons which determine significant difference such as student’s t-tests, you must have no fewer than 10 trials.
Analytics and Tables 3 Trials Dependent ( responding ) Independent ( manipulated ) This is a well designed table containing all of the information and data points required by IB: • Data tables must record both raw and mean data. • Data tables must have informative and descriptive column headers including units where necessary and uncertainty.
Analytics and Tables Continued In order to determine the uncertainty in the dependent variable we reproduce the first two rows of the previous table: The uncertainty in the average height h was taken to be half the largest range in the trial data, which is in the row for n = 2 sheets: 53.4 - 49.6 = 2.0. 2 If there is a necessary calculation performed on the raw data to produce your dependent variable (for instance if the dependent variable were to be potential energy for a ball, which was PE=m∙g∙h we would need the constant values for mass ± uncertainty in mass and gravity (assumed a constant 9.8). Then we would have to use the fractional uncertainty formula to calculate our error through the calculation.
Analytics and Graphing When making a graph it is required that you plot the data as scatter points. You must also plot the error in the dependent variable using properly designed error bars. Error can either be generated by using the range/2 formula or by more rigorous methods if you have sufficient data. Lastly, if possible you should have a trend line and a formula whose meaning is explicitly known. Golden rule: the fit line must pass through all error bars to be valid, as well as be to the lowest possible power. Error bars go up 2 and down 2 at each point.
intercept & uncertainty slope & uncertainty mmax - mmin 2 bmax - bmin 2 mbest m = mbest bbest b = bbest Analytics and Graphing Error in Slopes and Intercepts Uncertainty of gradient and intercepts To determine the uncertainty in the gradient and intercepts of a best fit line we look only at the first and last error bars, as illustrated here: mmax mbest intercept slope mmin bmin bbest Recall: y = mx + b bmax
Practice: Graphing Error in Slopes and Intercepts Calculate the error in the trend line slope and intercept using the provided formula and first/last error bars. The minimum slope is calculated from the bottom of the first bar to the top of the last: What are these resulting values? Then calculate the resulting uncertainty in slope based on the data: m = Then the reported slope is -1.633±0.25 Now do the same for the y intercept. b = Then the reported y-intercept is 56.067±2 mmax - mmin 2 bmax - bmin 2