Body Composition Assessment
Body Composition Assessment. A description of assessment methods. Body Composition. The relative % of body weight that is fat and fat-free tissue. Why measure body comp?. Health Implications there is an ideal % fat for health reasons (prevent onset of diabetes, CHD, BP, etc…)

Body Composition Assessment
E N D
Presentation Transcript
Body Composition Assessment A description of assessment methods.
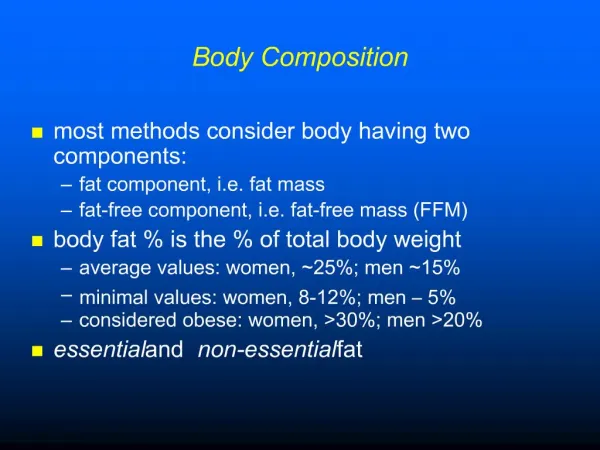
Body Composition • The relative % of body weight that is fat and fat-free tissue
Why measure body comp? • Health Implications • there is an ideal % fat for health reasons (prevent onset of diabetes, CHD, BP, etc…) • Make BW recommendations • can use % fat values to determine an ideal BW • how much fat to lose versus how much muscle to gain
Height - Weight Tables • Body composition is a better indicator of fitness than body weight/height. Standard height-weight tables do not provide accurate estimates of what you should weigh because they do not take into account the composition of the weight. A subject can be overweight according to these tables yet have very little body fat.
For example: • Body Builder: • 5’5” • 200 pounds • overweight according to height/weight tables • 4% body fat • ALL MUSCLE!!!
Fat Mass vs. Fat-free Mass • Two Component Model • Fat-free mass is composed of all of the body's nonfat tissue including bone, muscle, organs, and connective tissue. Fat mass includes all the body’s fat along with essential fat.
Essential Fat • All fat is not bad!! • We need fat for padding of organs, insulation, energy source • There is a minimum amount that we need to function daily = essential fat • Gender specific • males ~ 3% • females ~ 7%
Essential Fat • Why the differences? • A male at 7% is like a female at 17% • Women are more complicated!! • Women have babies, menstrual cycles, etc… and need more fat for the survival of the species
Methods • 1. Under Water Weighing (Hydrodensitometry) • 2. Bioelectrical Impedance (BIA) • 3. Dual-Energy X-ray Absorptiometry (DEXA) • 4. Near-Infrared Interactance (NIR)
Methods • Anthropometric Measures (anthro=body; metric=measuresbody measurements) • 5. Skinfolds • 6. Circumference (WHR) • 7. Diameters (body typing) • 8. Height (BMI) • 9. Others…..??
Hydrodensitometry • Used to be considered the most accurate (up for debate now that DEXA is used) • +2.5% if done with experienced subjects
UWW • Fat Component - Fat (adipose)+Neural+Essential Fat • density of 0.9 g/ml • Fat-Free Component - muscle+bones+ tendons+organs • density of 1.10 g/ml
UWW • Water Density ~ 1.0 g/ml (temperature of the water affects the density) • Thus, if more fat will float (fat is less dense than water) • If more muscle will sink (muscle is more dense than water)
Procedures • 1. Wear light clothing (swimsuit) • 2. Use bathroom prior to weighing • 3. Calibrate scale • 4. Weight the chair or seat and equipment • 5. Measure water temp • 6. Remove all air from clothing
Procedures • 7. Sit in seat • 8. Submerge • 9. Blow all air out of lungs and remain still • 10. 3-10 trials; average of the highest three • 11. Subtract weight of apparatus from average UWW
Equations • % fat = 457÷BD - 4142 • %fat = 495÷BD - 450
Sources of Error • Not getting all air out • Reading scale wrong • Are not using the correct equation • Estimation of RV
BIA • Based on the premise that fat-free tissue is a better conductor of an electrical current (contains water and electrolytes) than fat tissue • The resistance to current flow is inversely related to FFM
BIA • Abstain from eating or drinking for 4 hours prior • No exercise 12 hours prior • No alcohol 48 hours prior • No diuretics (caffeine) prior to assessment
Advantages • Non-invasive • Safe • Easy to administer • Accurate on some populations • Field technique
Disadvantage • The accuracy has been questioned: • Skinfolds 2.4 % error • BIA 5% error • Visual 3.1% error • Race cannot be entered into the machine • Children distribute water differently than adults
NIR • Based on the premise that the degree of infrared light absorption is related to the composition of the substance through which light passes • Fat and Fat-Free Mass absorb and reflect light differently
Advantages • Non-invasive • Safe • Easy to administer • Field technique
Disadvantages • Cost? Is it worth it? • Few Age/Gender Specific Equations • Accurate? • Futrex 5000 3.1-4.2% • Futrex 5000A 6.3% • Futrex 1000 4.8-6.3% • Sum 3 2.4-3.6 • BIA 5.0-7.1%
Skinfolds • Measurement of subcutaneous adipose tissue at specific anatomical sites • BD or %fat is obtained with the use of equations (either population specific or generalized)
SF Procedures • Take all measurements on the right side of the body • Identify and mark site • Grasp skin and fat between thumb and index finger 1cm above marked site • Continue grasping at the site while taking the measurement
SF Procedures • Take at least 2-3 non-consecutive measurements - if values vary by +2mm take additional measurements • No measurements directly after exercise
Sites • Chest • Subscapular • Midaxillary • Suprailiac • Abdominal • Triceps • Biceps • Thigh • Calf
Equations • Jackson’s 3-site • Males - BD=1.10938-0.0008267(sum3)+0.0000016(sum3)2-0.0002574(age) • chest, abdomen, thigh • Females - BD=1.0994921-0.0009929(sum3)+0.0000023(sum3)2-0.0001392(age) • triceps, suprailiac, thigh
Skinfolds • Use text table 4.1, 4.2, 4.3, 4.9
Circumferences • 1. Waist to Hip Ratio • 2. Determination of Body Comp
Waist to Hip Ratio • Indication of the pattern of body fat distribution • Indicator of the health risks of obesity • excess trunk fat - increased risk of hypertension, type 2 diabetes, high cholesterol, CAD, premature death
Measurements • Made with a tape measure • Waist - at the level of the umbilicus • Hips - biggest part of the gluteals
Waist to Hip Ratio • Risks increase with increasing ratios • Men • Very low risk <.95 • Low risk .96-.99 • High risk >1.00
Waist to Hip Ratio • Risks increase with increasing ratios • Women • Very low risk <.80 • Low risk .81-.84 • High risk >.85
Determination of Body Comp • Figure 4.5 and Table 4.4, 4.9
Body Mass Index (BMI) • Ratio of a person’s weight (kg) to the height squared (m2) • Used to categorize people with respect to their degree of obesity • Not used to determine % fat • Table 4.7 and Table 4.8
BMI • <20 - underweight • 20-25 kg/m2 - acceptable • 25-29.9 kg/m2 - overweight • >30.0 - obesity
Calculations for Optimal BW • 1. Determine % fat • 2. Calculate Fat Weight • BW * %fat ÷ 100 • 3. Calculate Fat-Free Weight • BW - FW • 4. Calculate Desirable Weight • FFW ÷ (1- (desired %fat ÷ 100))
Calculations • 5. Calculate amount of weight that needs to be lost • BW - Desirable Weight • 6. Calculate kcal deficit • 3500 kcal per pound of weight needed to be lost • 7. Assuming loss of 1 pound (3500 kcals) per week, calculate # weeks to reach goal
Assignment Lab 4B