MLC Investments – Performance Preview
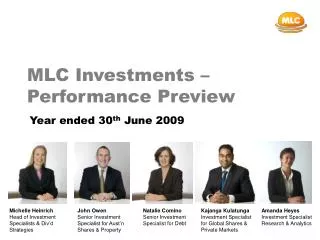
MLC Investments – Performance Preview. Year ended 30 th June 2009. Michelle Heinrich Head of Investment Specialists & Div’d Strategies. John Owen Senior Investment Specialist for Aust’n Shares & Property. Natalie Comino Senior Investment Specialist for Debt. Kajanga Kulatunga

MLC Investments – Performance Preview
E N D
Presentation Transcript
MLC Investments – Performance Preview Year ended 30th June 2009 Michelle Heinrich Head of Investment Specialists & Div’d Strategies John Owen Senior Investment Specialist for Aust’n Shares & Property Natalie Comino Senior Investment Specialist for Debt Kajanga Kulatunga Investment Specialist for Global Shares & Private Markets Amanda Heyes Investment Specialist Research & Analytics
Disclaimer This information has been provided by MLC Limited (ABN 90 000 000 402) a member of the National Group, 105-153 Miller Street, North Sydney 2060. This material was prepared for advisers only. MLC Investments Limited ABN 30 002 641 661 is the issuer of interests in each fund of the MLC MasterKey Unit Trust and MLC Nominees Pty Limited ABN 93 002 814 959 is the issuer of MLC MasterKey Superannuation and the MLC Allocated Pension. Information about the MLC MasterKey Horizon Series is available in the current Product Disclosure Statement (‘PDS’) or other disclosure document, copies of which are available upon request by phoning the MasterKey Service Centre on 133 433 or on our website at mlc.com.au. Persons should consider the relevant PDS in deciding whether to acquire, or to continue to hold, this product. Persons wishing to acquire an interest in this product must complete the application form attached to the relevant PDS. Any advice in this communication has been prepared without taking account of individual objectives, financial situation or needs. Because of this you should, before acting on any information in this communication, consider whether it is appropriate to your objectives, financial situation and needs. You should obtain a Product Disclosure Statement or other disclosure document relating to any financial product issued by MLC Investments Limited (ABN 30 002 641 661) and MLC Nominees Pty Ltd (ABN 93 002 814 959) as trustee of The Universal Super Scheme (ABN 44 928 361 101), and consider it before making any decision about whether to acquire or continue to hold the product. A copy of the Product Disclosure Statement or other disclosure document is available upon request by phoning the MLC call centre on 132 652 or on our website at mlc.com.au. An investment in any product offered by a member company of the National group does not represent a deposit with or a liability of the National Australia Bank Limited ABN 12 004 044 937 or other member company of the National Australia Bank group of companies and is subject to investment risk including possible delays in repayment and loss or income and capital invested. None of the National Australia Bank Limited, MLC Limited, MLC Investments Limited or other member company in the National Australia Bank group of companies guarantees the capital value, payment of income or performance of any financial product referred to in this publication. Past performance is not indicative of future performance. The value of an investment may rise or fall with the changes in the market. Please note that all return figures reported are before management fees and taxes, and for the period up to 30 June 2009, unless otherwise stated. The specialist investment management companies are current as at 30 June 2009. Funds under management figures are as at 30 June 2009, unless otherwise stated. Investment managers are regularly reviewed and may be appointed or removed at any time without prior notice to you. 2
Contents Slide no. • The recent environment 4 • Impact on asset class returns 8 • Impact on MLC multi-manager funds 10 • MLC Horizon 4 11 • MLC Australian share strategies 16 • MLC Property Strategies 24 • MLC Global Strategies 31 • MLC Diversified Debt strategies 35 • The outlook 41 • Appendix 46 3
The Recent Environment: No-where to hide Source: Thomson Financial. 4
Global Green shoots? Source: Composite based on US ISM survey, Japanese Tankan survey and European commission on economic sentiment survey. 5
Credit markets have gone a long way towards reversing their post-Lehman losses 7
Contents Slide no. • The recent environment 4 • Impact on asset class returns 8 • Impact on MLC multi-manager funds 10 • MLC Horizon 4 11 • MLC Australian share strategies 16 • MLC Property Strategies 24 • MLC Global Strategies 31 • MLC Diversified Debt strategies 35 • The outlook 41 • Appendix 46 8
Impact on investment market returns Source: MLC Investment Management. Index Returns 9
Contents Slide no. • The recent environment 4 • Impact on asset class returns 8 • Impact on MLC multi-manager funds 10 • MLC Horizon 4 11 • MLC Australian share strategies 16 • MLC Property Strategies 24 • MLC Global Strategies 31 • MLC Diversified Debt strategies 35 • The outlook 41 • Appendix 46 10
MLC MK Super Fundamentals: Horizon & LTAR Returns* to 30th June 2009 • 3 month & 1 year returns are MLC Super Fundamentals Super, 5 & 10 year returns are MLC Gold Star Super, both are net of fees & taxes. MLC Super Gold Star fees for H1 –H7 range from 1.91% - 2.48% LTAR is 2.76%, including adviser trail. 11
MLC Horizon 4 - Consistent added value across market cycles Horizon 4’s 5 year return has not dipped below 0% in the past. Losses over 1 year periods occur with almost boring regularity. The rally in risky assets of CYTD2009 is reflected in the up tick in total returns on the RHS. Source: Mercers Retail Balanced Growth Universe, net of super tax and Gold star fees. Mercer data updated around the 20th day after month end. 12
Net* performance of MLC Horizon 4 (Super): Rolling 1, 3 & 5 Year Relative Returns % of time outperformed competitors: 1 year: 58% 3 years: 63% 5 years: 78% Source: Mercers Retail Balanced Growth Universe, net of super tax and Gold star fees. Mercer data updated around the 20th day after month end. 13
MLC Super Horizon 4: Absolute Volatility Standard Deviation (5 year rolling) 62% below median Source: Mercers Retail Balanced Growth Universe, net of super tax and Gold star fees. Mercer data updated around the 20th day after month end. 14
MLC Super LTAR performance Source: MLC Investment Management 15
Contents Slide no. • The recent environment 4 • Impact on asset class returns 8 • Impact on MLC multi-manager funds 10 • MLC Horizon 4 11 • MLC Australian share strategies 16 • MLC Property Strategies 24 • MLC Global Strategies 31 • MLC Diversified Debt strategies 35 • The outlook 41 • Appendix 46 16
MLC Australian Shares: Strategy (top) and Manager (bottom) Update Manager specific excess return for year ended 30 June 2009 Source: MLC Investment Management. Before the deduction of fees & taxes. 18
Australian Shares Stock Story: Wesfarmers share placement (Using market opportunities to the advantage of clients) Current share price $22.87 Shares listed on 4 March Shares placed at $13.50 p.s. on 22 January Source: IRESS 19
MLC IncomeBuilder’s Primary objective: Increasing income stream with tax advantages Source: MLC investment Management, for MLC Unit Trust IncomeBuilder. 20
MLC IncomeBuilder: Market/Sector Update: Sector Returns (%) to 30 June 2009 Source: IRESS 21
MLC IncomeBuilder Stock Story: BlueScope Steel share placement (Using market opportunities to the advantage of clients) MLC IncomeBuilder’s managers participated In Bluescope Steel’s capital raising at a price of $1.55 per share, an all time low since the Company listed in July 2002 Source:IRESS 22
Contents Slide no. • The recent environment 4 • Impact on asset class returns 8 • Impact on MLC multi-manager funds 10 • MLC Horizon 4 11 • MLC Australian share strategies 16 • MLC Property Strategies 24 • MLC Global Strategies 31 • MLC Diversified Debt strategies 35 • The outlook 41 • Appendix 46 23
Australian Real Estate Investment Trusts (AREITs): Market Update (10 years to 30 June 09) The sector has recently recovered from historic lows Source: IRESS, S&P/ASX200 Accumulation Index. 24
MLC AREIT: Strategy (top, rolling 1 year) and Manager (bottom, year to 30 June 2009) Excess returns Manager specific excess return for year ended 30 June 2009 Source: MLC Investment Management. Before the deduction of fees & taxes. 25
MLC AREIT Stock Story: CFS Retail Property Trust Price of CFS Retail vs AREIT Index • Approx. 6.4% of the total MLC Property Securities Fund. • Second strongest performer in the AREIT sector YTD (-11%) and significant outperformer vs index • Opportunistic $325 million equity raising in October ’08 underpins financial position • Modest borrowings (25.6% gearing) positions the Trust well financially versus many other AREITs • Quality Australian based retial shopping centre portfolio • One of few REITs not to slash distributions (so far) Source: IRESS 26
Global Real Estate Investment Trusts (GREITs) Market Update (to 30 June) S&P / UBS Global Investors Accumulation Index: 30 June 2009 Source: Resolution Capital 27
MLC GREIT: Strategy (top, rolling 1 year) and Manager (bottom, year to 30 June 2009) Excess returns Manager specific excess return for year ended 30 June 2009 Source: MLC Investment Management. Before the deduction of fees & taxes. Note: Morgan Stanley’s excess return is based on soft close preliminary data. 28
MLC GREIT Stock Story: Unibail (France) Source: Resolution Capital 29
MLC GREIT Stock Story: DuPont Fabros (USA) Source: Resolution Capital 30
Contents Slide no. • The recent environment 4 • Impact on asset class returns 8 • Impact on MLC multi-manager funds 10 • MLC Horizon 4 11 • MLC Australian share strategies 16 • MLC Property Strategies 24 • MLC Global Strategies 31 • MLC Diversified Debt strategies 35 • The outlook 41 • Appendix 46 31
MLC Global share fund update – reversal of returns Data source: Capital International, analysis MLC Investment Management 32
Impact of style – Global Growth vs. Value? Some companies you own! Source: State Street Global Markets, Quantitative Strategy Monthly, June 2009 33
MLC Global private markets update Vintage Year Commitments All Data as at 31 May 2009 34
Contents Slide no. • The recent environment 4 • Impact on asset class returns 8 • Impact on MLC multi-manager funds 10 • MLC Horizon 4 11 • MLC Australian share strategies 16 • MLC Property Strategies 24 • MLC Global Strategies 31 • MLC Diversified Debt strategies 35 • The outlook 41 • Appendix 46 35
MLC’s Diversified Debt Fund and Horizon 1 – Bond Portfolio Update Market update • Anticipation of an economic recovery has started to feed into the debt market which has improved liquidity over the last quarter. • Money is now flowing from the “safe haven” of government debt, into higher credit risk markets. That’s why 3 mth returns are so high but 1 and 3 year are still poor – they still have a way to go to recover the losses after Lehman Brothers’ collapsed in September 2008. • Yields on inflation linked securities have risen because the market expects the government to increase issuance (supply) of these securities, pushing prices down and yields up. Source: MLC Investment Management 36
MLC Diversified Debt Fund Update Strategy update • We are seeing a reversal in the ground we lost in the few months after Lehman Brother’s collapsed. • MLC’s position relative to peers and the market that hurt performance after Lehman’s collapsed, are now helping returns - overweight to credit risk (and underweight to government securities) and overweight to global nominal bonds (and underweight to Australian) • Overweight exposure to inflation linked securities, which helped returns in the “flight to quality” after Lehman’s collapse, has hurt returns in recent months. 37
MLC Diversified Debt Fund Update High yield bond story – Texas Competitive Electric Holdings Company LLC (TCEH) • TCEH is a successful power producer. It is the 2nd largest deregulated power generator in the US and the largest retail electricity provider in Texas. It has relatively steady operating cash flow due mostly to the consistent demand for power in Texas where it’s generating facilities are located. It also has no significant debt maturities in the next few years. • But because of the forced selling of high yield securities following Lehman Brothers’ collapse, the price of the bond in MLC’s portfolio fell sharply and yields rose. • WR Huff continued to believe the bond was “money good” and TCEH continued to operate as normal and honour interest payments. 38
MLC Horizon 1 – Bond Portfolio Update Strategy update – at last the low risk portfolio has come into its own! • Because the Portfolio is designed to provide capital preservation it has been well insulated from credit market gyrations over the past year. The portfolio has achieved a consistently solid positive annual return. • Some exposure to the credit market has helped to boost returns recently but is really just recovering lost returns post Lehman Brothers’ collapse. • Exposure to inflation linked securities, which helped returns in the “flight to quality” after Lehman’s collapse, has hurt returns in recent months. • Cash was one of the better performing types of debt this past year. Now that the official cash rate has remained at 3% since beginning of April, prospective returns are not great. That’s why the cash exposure is a focal point for the debt review, underway at present. • This last year, the benefits of a diversified debt portfolio have been evident. 39
MLC Horizon 1 – Bond Portfolio Update Strategy story • Horizon 1 investors experienced capital preservation despite gyrations in most debt markets over the past year. That’s because more than 70% is invested in our lowest risk debt strategies (circled). 40
Contents Slide no. • The recent environment 4 • Impact on asset class returns 8 • Impact on MLC multi-manager funds 10 • MLC Horizon 4 11 • MLC Australian share strategies 16 • MLC Property Strategies 24 • MLC Global Strategies 31 • MLC Diversified Debt strategies 35 • The outlook 41 • Appendix 46 41
MLC Horizon Return Potential*: as at July 2007 & January 2009 MLC Horizon 2 MLC Horizon 4 MLC Horizon 6 MLC Horizon 7 MLC Horizon 3 MLC Horizon 5 42 Source: MLC Investment Management, * starting valuations as at July 2007 and January 2009. 42
Asset Class Return Potential as at end June 2009* Source: MLC Investment Management, *Starting valuations as at end June 2009. 43
MLC Diversified Fund Return Potential as end June 2009* Source: MLC Investment Management, *Starting valuations as at end June 2009. 44
The Outlook • Global leading indicators, (consumer and business sentiment, and sharemarkets) are telling us economic recovery is starting despite lagging indicators (GDP, unemployment) still weakening • The recovery seems likely to be VERY subdued – consumers (especially in the English speaking world) will take time to repair balance sheets and re-build savings • Inflation whilst not a short term risk remains a medium term risk • Emerging nations may recover more strongly than developed economies • The Australian economy has so far held up well and is well positioned to benefit from a potential shift in global growth towards developing economies, particularly in Asia • Investment return potential in this recovery is more modest than we’ve been used to and volatility is likely to remain high • Diversification & discipline are still your best friends! 45
Appendix 46
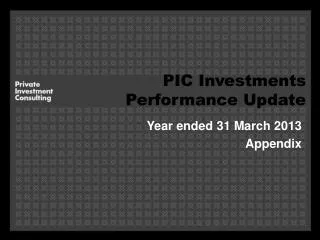
PIC Wholesale Horizon & LTAR Returns* to 30 June 2009 • IDPS Fundamentals, MLC LTAR, MLC Income fund and MLC Bond Fund do not have a 5 year track record. Returns are net of fees but before the deduction of any rebates. 47
PIC IDPS - Consistent added value across market cycles Horizon 4’s 5 year return has not dipped below 0% in the past. Losses over 1 year periods occur with almost boring regularity. The rally in risky assets of CYTD2009 is reflected in the up tick in total returns on the RHS. Note: Mercer data is updated around the 20th business day after month end. 48
Net* performance of PIC IDPS Horizon 4: Rolling 1, 3 & 5 Year Relative Returns % of time outperformed competitors: 1 year: 38% 3 years: 38% 5 years: 30% 49 Source: Mercers Retail Balanced Growth Universe, net of super tax and Gold star fees. Mercer data updated around the 20th day after month end. 49
MLC PIC IPDS Horizon 4: Absolute volatility (5 yr rolling) 15% below median 50