Download
1 / 22
230 likes | 515 Vues
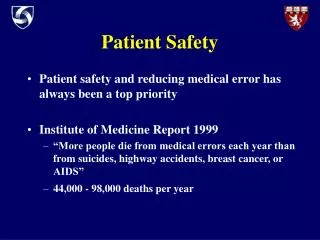
Adverse Patient Safety Events: Costs of Readmissions and Patient Outcomes Following Discharge. Didem M. Bernard, Ph.D. William E. Encinosa, Ph.D. Patient Safety Events. IoM estimated that between 44,000 and 98,000 people die in hospitals each year as a result of medical errors

E N D
Adverse Patient Safety Events: Costs of Readmissions and Patient Outcomes Following Discharge Didem M. Bernard, Ph.D. William E. Encinosa, Ph.D.
Patient Safety Events • IoM estimated that between 44,000 and 98,000 people die in hospitals each year as a result of medical errors • Medical errors is the eighth leading cause of death in the U.S. • IoM recommended at least a 50% reduction in medical errors over 5 years
Background • Medical injuries during hospitalizations lead to excess length of stay, charges and mortality (Zhan and Miller, 2003) • Whether adverse patient safety events have a significant impact on patient outcomes and costs following discharge is less clear
Research Questions Do adverse patient safety events during hospitalizations have an effect on patient outcomes following discharge? Are there long-term costs associated with potentially preventable adverse medical events?
Patient Safety Indicators • We use the AHRQ Patient Safety Indicators (PSI) developed by the UCSF- Stanford Evidence-Based Practice Center (EPC) and UC-Davis (2003). • EPC selected 14 indicators among 63 complication indicators using • Indicator validity results from the literature • Empirical analyses of the precision and reliability of the candidate PSIs • Review of potential indicators by 11 clinical panels
Patient Safety Indicators • Anesthesia Complications * • Accidental Puncture or Laceration During Procedure • Foreign Body Left In During Procedure* • Hemorrhage or Hematoma • Wound Dehiscence • Infection Due to Medical Care • Pulmonary Embolism and Deep Vein Thrombosis * Labeled as medical errors
Patient Safety Indicators (cont.) • Iatrogenic Pneumothorax* • Acute Respiratory Failure • Sepsis • Physiologic and Metabolic Derangements • Transfusion Reaction • Hip Fracture* • Decubitus Ulcer* * Labeled as medical errors
Data • 2002 California Hospital Discharge Data AHRQ Healthcare Cost and Utilization Project (HCUP) State Inpatient Database (SID) • Hospital Inpatient Cost to Charge Ratios • Area Wage Index (CMS) • Number of Hospitals: 349
Analytic Sample and Methods • Major Surgery Discharges (17<age<65) From February 1, 2002 to November 30, 2002 • Index admission: A major surgery admission with no hospitalizations in a 30 day window prior to the admission date (N=602,361) • Readmission: Any hospitalization within 30 days of initial discharge
Patient Outcomes • Probability of readmissions • Probability of death during index admission • Probability of death during any readmission within 30 days of initial discharge
Costs of Adverse Patient Safety Events • Index admission costs • Costs of readmissions • Total costs for index admissions and readmissions within 30 days following discharge
Basic Model: Hospital Costs i=person y= cost of hospitalization* PSI= (0,1) indicator equals 1 if patient has at least one adverse patient safety event x=control variables * Index admission, readmission or total hospital costs
Basic Model: Patient Outcomes i=person y=(0,1) indicator equals 1 if patient is readmitted within 30 days of discharge* PSI= (0,1) indicator equals 1 if patient has at least one adverse patient safety event x=control variables * y=(0,1) indicator equals 1if patient dies during hospitalization
Control Variables • Patient: age, sex, race/ethnicity, transfer admission, emergency admission, 30 chronic conditions, MDC, zipcode level median household income • Hospital: teaching status, ownership type, bedsize • Market: Health Service Area dummies
Estimation • Costs: GLM (Generalized Liner Method) log-link with Gamma distribution (Manning and Mullahy, 2001) • Patient Outcomes: Logit regressions • Simulation results: A : Predicted costs/outcomes with PSI=1 B : Predicted costs/outcomes with PSI=0 (A – B) : Predicted costs/outcomes due to adverse patient safety events
Simulation Results: Outcomes * Significantly different from zero at the 99% level
Simulation Results: Outcomes (cont.) * Significantly different from zero at the 99% level
Simulation Results: Costs * Significantly different from zero at the 99% level
Summary • Excess costs and adverse outcomes of adverse patient safety events are not limited to the initial hospitalization • Adverse patient safety events during hospitalizations lead to • Higher probability of readmissions • Higher probability of in-hospital death following discharge • Higher inpatient costs following discharge
Policy Implications A reduction in adverse patient safety events will not only improve quality of care but also reduce long-term health care costs