Download
1 / 11
110 likes | 217 Vues
Energy demand extends far beyond visible consumption, integrating economic services tied to businesses and households. This comprehensive assessment reveals that hidden energy demand from services can be four times greater than recorded energy use. By focusing solely on fuel for machines, we overlook substantial energy consumption originating from business services. Understanding this hidden demand is crucial, as growing economic activities and improved energy efficiency lead to greater environmental impacts. An updated economic model is needed to accurately account for all energy interactions within the business ecosystem.

E N D
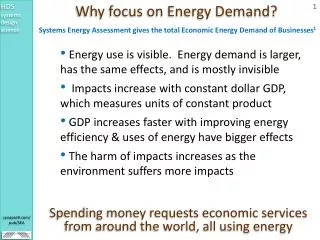
HDS systems design science Why focus on Energy Demand? Systems Energy Assessment gives the total Economic Energy Demand of Businesses1 • Energy use is visible. Energy demand is larger, has the same effects, and is mostly invisible • Impacts increase with constant dollar GDP, which measures units of constant product • GDP increases faster with improving energy efficiency & uses of energy have bigger effects • The harm of impacts increases as the environment suffers more impacts Spending money requests economic services from around the world, all using energy synapse9.com/ pub/SEA
HDS systems design science Part of the Total Demand Wasn’t Counted Counting only business fuel use, misses the energy demand of business services One Barrel counted purchased fuel use for machines 4 Barrels not counted energy demand for business services Spending money requests economic services from around the world, all using energy synapse9.com/ pub/SEA
HDS systems design science Why wasn’t 80% of the energy counted?? The traditional economic accounting ignores that households run businesses purchased fuel use for machines The Economic System Model treats businesses and households as separate accounting categories, working independent of each other, one producing and the other consuming products. A Physical System Model treats businesses as working networks of households that consume to produce their services, counted as material services for business operation like technology costs are. “A Firm” is physically a cultural network of households that may employ technology too synapse9.com/ pub/SEA
HDS systems design science How Wide Spread is Energy Demand? Server/Buyer -- Seller/Maker -- Server/Buyer 2 -- Seller/Maker 2 Producer goods & services markets Consumer goods & services markets Producer goods & services markets Income Product Server/ Buyer Seller/ Maker $ $ If a buyer pays 200 different businesses a month, that pay to 200 different people, doing the same, in three months 200^3200^3 partial recipients of any dollar spent. As a cascade 6.4 10^13 end recipients are paid. For 5 billion economically active people on earth, each might receive portions of every dollar spent three months earlier by13 thousand different paths!1 Other purchases from the Buyer’s income synapse9.com/ pub/SEA Money demands exceedingly diverse energy use
HDS systems design science How Big is Energy Demand? • Hidden energy demand from business services is ~4 times the energy uses recorded1 • All money ends as pay for people operating the businesses that pay them. • Energy/$ for consumption is “about average” 8000btu/$ and .47kgCO2/$1 • So money measures hidden energy demand • US municipal solid waste - 4.5 lb/person.dy2 • US energy demand CO2 – 110 lb/person.dy3 Total energy demand often 5 times the visible synapse9.com/ pub/SEA
HDS systems design science A business unit, at the point of sale • Parts that need to work together • Materials • Tools • Workplace • Workers • Environment • Natural Resources • Purchased Products • Technology • Structures • Development • Real Estate • Organization • Operators • Operation services • Managers • Government • Finance • Society Coordinated parts that alltake energy to deliver synapse9.com/ pub/SEA
HDS systems design science Businesses as environmental systems Business Unit Business Unit Business Unit Corporation Field Unit Field Unit Product Markets Community Relations Office Supply & Service Development Supply Field Supply & Service Finance and Government Relations Corporate Supply & Service Field Unit Natural World • Systems are environments for their parts • Matched active and passive parts work as Organized Units • Cells, Organisms, Businesses, Cities, Cultures, Economies • Growth starts with local resources and a seed of design • Growing control of their environment ends in a stable relationship with it, or runs out. Systems are market places with all your stuff synapse9.com/ pub/SEA
HDS systems design science Adjusting the way of counting energy use Original Figure borrowed from George Mobus4 • Counting material energy + demand • Energy uses are now traced from resource extraction to product use. • Energy need of material processes counted, but not needs for services. • Food as material input to labor, and material energy inputs to food, may be counted. • Energy demand created by paying labor and other services for running the business is not counted. • Energy demand from services is ~80% of total business energy need All consumption paid for as a service to production Original Figure was simplified for reduction here, adding yellow circles and note to represent the addition the energy demand of business services. The model of counting only the material energy uses of the material chain of production is typical of H.T. Odum and others, such as the LCA world standard for business energy accounting synapse9.com/ pub/SEA Counting observed energy use, not energy demand
HDS systems design science • Life Cycle Energy For a Model Wind Farm 32% dSEA4 – Services of government and finance 19% – Material costs of wind farm technology, 1/5 of the total Capital Equipment Business Environ. cost 4% dSEA3 – Service of corporate management Development Services Cost 4% dSEA2 – Service of business management 28% dSEA0 – Service cost of wind farm technology Business Offices Field Cost 13% dSEA1 – Service of field operations Adding up the total for each scale of system organization, working as a unit Systems Energy Assessment (SEA) Money paid to people creates ~4 times the energy use as material costs of machines synapse9.com/ pub/SEA
HDS systems design science Adding up Total Energy Demand • Each business expense is assessed for fuel use and economic demand • Energy intensity adjustment, Tii and Eii, times average intensity EE cost = energy use and demand • The world average energy intensity, EiW= 1.883kWh/$, • There is the simple quick way and the long complicated wau • The total cost times EiW is quick,$*EiW = 401kWh, 86% of 465kWh • The old way, counting only material energy uses is off by 500% Money is a far more accurate measure of energy use than energy uses synapse9.com/ pub/SEA
HDS systems design science Notes • Symbols: Tii = tech fuel use rate factor; Eii = econ demand rate factor; Tii and Eiiadjust the world average economic intensity EiW to give the total energy demand per dollar of cost. • Symbols: TE = tech fuel use total, EE = econ fuel use total; $T = economic value added for TE using 1/EiW; $E is either the actual cost or = the economic value added for EE using 1/EiW • World Average GDP energy intensity, EiW from EIA = 1.883kWh/$, declining at ~1.24%/yr. • Tax rate on net revenue is 36%, approximating the ratio of US combined local, state and federal government costs to GDP, from http://www.usgovernmentrevenue.com/yearrev2008_0.html • New Discussion,links and updates might be found at the Systems Energy Assessment web page, www.synapse9.com/pub/SEA • P.F. Henshaw (2011) System Energy Assessment (SEA): Defining EROI for Energy Businesses as Whole Systems, for Sustainability MDPI and in Cornel physics archive arXiv:1104.3570v1 • US EPA (2008) Municipal Solid Waste Generation, Recycling, and Disposal in the United States: Facts and Figures for 2008 http://www.epa.gov/osw/nonhaz/municipal/pubs/msw2008rpt.pdf • based on $40,584/yr US per capita income, times .47kg/$, the world average production of CO2/$ of GDP • George Mobus Feb 6, 2011 blog post “Yet another look at cost inflation” http://questioneverything.typepad.com/question_everything/2011/02/yet-another-look-at-cost-inflation.html References synapse9.com/ pub/SEA P.F. Henshaw - 10-Jun-11