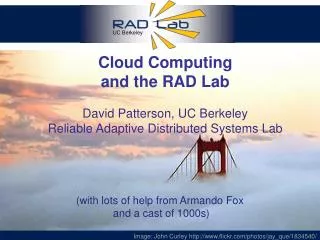
Energy Efficiency and Cloud Computing David Patterson, UC Berkeley Reliable Adaptive Distributed Systems Lab
Energy Efficiency and Cloud Computing David Patterson, UC Berkeley Reliable Adaptive Distributed Systems Lab. Image: John Curley http://www.flickr.com/photos/jay_que/1834540/. Outline. Energy Proportionality vs. Reality Turing Off Servers vs. Ensuring Full ROI Turning Off and Reliability


Energy Efficiency and Cloud Computing David Patterson, UC Berkeley Reliable Adaptive Distributed Systems Lab
E N D
Presentation Transcript
Energy Efficiency and Cloud Computing David Patterson, UC BerkeleyReliable Adaptive Distributed Systems Lab Image: John Curley http://www.flickr.com/photos/jay_que/1834540/
Outline • Energy Proportionality vs. Reality • Turing Off Servers vs. Ensuring Full ROI • Turning Off and Reliability • Defining Cloud Computing • RAD Lab Vision • Datacenter OS and Energy Efficiency • Datacenter Store and Energy Efficiency
Datacenter Is New “Server” • “Program” == Web search, email, map/GIS, … • “Computer” == 1000’s computers, storage, network • Warehouse-sized facilities and workloads • New datacenter ideas (2007-2008): truck container (Sun), floating (Google), datacenter-in-a-tent (Microsoft) • How to enable innovation in new services without first building & capitalizing a large company? photos: Sun Microsystems and datacenterknowledge.com
Tie to Cloud Computing • Cloud Computing saves energy? • Don’t buy machines for local use that are often idle • Better to ship bits as photons vs. ship electrons over transmission lines to spin disks locally • Clouds use nearby (hydroelectric) power • Leverage economies of scale of cooling, power distribution
Tie to Cloud Computing • Techniques developed to stop using idle servers to save money in Cloud Computing can also be used to save power • Up to Cloud Computing Provider to decide what to do with idle resources • New Requirement: Scale DOWN and up • Who decides when to scale down in a datacenter? • How can Datacenter storage systems improve energy?
Energy Proportional Computing It is surprisingly hard to achieve high levels of utilization of typical servers: Most of time10% to 50% “The Case for Energy-Proportional Computing,” Luiz André Barroso, Urs Hölzle, IEEE Computer December 2007 Figure 1. Average CPU utilization of more than 5,000 servers during a six-month period. Servers are rarely completely idle and seldom operate near their maximum utilization, instead operating most of the time at between 10 and 50 percent of their maximum
Energy Proportionality? • How close to “Energy Proportionality”? • 10% of peak utilization => 10% of peak power? • “The Case for Energy-Proportional Computing,” Barroso and Hölzle, IEEE Computer, Dec. 2007 Energy Proportionality
Benchmarking Power • SPECPower benchmark December 2007 • Run ~SPECJBB Java benchmark (requests/s) • Vary requests/s in 10% increments:100% to 0% • Single number sum of requests / sum of power • 1.5 years for companies to compare results, innovate, and tune hardware and software • Publish results every quarter: > 100 results • Average result improved 3X in 1.5 years • Benchmarketing or real progress?
SPECPower Results Energy Proportionality • SPECpower 2008: • Average of 23 results from 2Q 2009 • 50% utilization => 74% Peak Power • 10% utilization => 54% Peak Power • Save power by consolidate and turn off • 5 computers @ 10% = 270%1 computer @ 50% = 74% • Save 2/3 of power (during slower periods)
But Powering off Hurts Hardware Reliability? • Theory: if turn on and off infrequently, could IMPROVE reliability! • Which is better: hot and idle vs. turned off and no wear but cycle temperature? • Disks: MTTF measured in powered on hours • 50,000 start/stops guaranteed (~1/hour over lifetime) • More years if fewer powered on hours per year? • Integrated Circuits: there is small effect of being powered on vs. temperature cycle of off and on • One paper says improve lifetime by 1.4X if turn off 50% with infrequent power cycles (~1/hour over lifetime)
Small Experiment • DETER Project at ISI and Berkeley • 64 Nodes at ISI: Turn off when idle one hour • 64 Identical nodes at Berkeley: Always on • Ran for 18 months (so far) • Failures • ISI ≤ 3 failures • Berkeley 5 failures (but more temperature variation) • Didn’t hurt reliability (for small experiment)
Tradeoff: Turning Off vs. Ensuring Full ROI • Given diurnal patterns and high power even when idle, turn off computers and consolidate during traditional slow periods • Problem: Existing monitoring software assumes broken if server doesn’t respond: change monitoring software or ??? • Given huge capital investment in power and cooling, to maximize ROI, increase workload of other valuable tasks during traditional slow periods
Case for Getting Value • Cost of Internet-Scale Datacenter • James Hamilton, perspectives.mvdirona.com • Keynote, Int’l Symp. Computer Arch., 6/23/09 • Largest costs is server and storage H/W • Followed by cooling, power distribution, power • People costs <10%(>1000+:1 server:admin) • Services interests work-done-per-$ (or joule) • Networking $ varies: very low to dominant, depending upon service
Example Monthly Costs • 50,000 servers @ $2k/server • 15MW facility @ $200M, $0.07 per KWH • Power$ 1/3 Servers$, <Power, cooling infra. Servers Power Power and Cooling Infrastructure
Given Costs, Why Turn Off? • Only saving part of 20% of monthly costs • Better to run batch jobs (MapReduce) overnight to add value to company • (Or rent idle machines to others) • How much value do you really get from batch jobs? • Electric utility mandated reductions on crisis days (or pay more all year)? • Still true in future as Hardware costs fall and Power costs rise?
Example Monthly Costs • 50,000 servers @ $1k/server • 15MW facility @ $200M, $0.10per KWH • Power$ = Servers $, >Power, cooling infra. Servers Power Power & Cooling Infrastructure
DatacenterSReduce Cost? • Rather than elaborate, expensive batteries and diesel generators, rely on other datacenters to take over on failure • Reduces cooling and power infrastructure costs per datacenter, making power a larger fraction of monthly costs
Outline • Energy Proportionality vs. Reality • Turing Off Servers vs. Ensuring Full ROI • Turning Off Servers and Reliability • Defining Cloud Computing • RAD Lab Vision • Datacenter OS and Energy Efficiency • Datacenter Store and Energy Efficiency
But... • What is cloud computing, exactly?
“It’s nothing (new)” • “...we’ve redefined Cloud Computing to include everything that we already do... I don’t understand what we would do differently ... other than change the wording of some of our ads.” • Larry Ellison, CEO, Oracle (Wall Street Journal, Sept. 26, 2008)
Above the Clouds:A Berkeley View of Cloud Computing • abovetheclouds.cs.berkeley.edu • 2/09 White paper by RAD Lab PI’s and students • Clarify terminology around Cloud Computing • Quantify comparison with conventional computing • Identify Cloud Computing challenges and opportunities • Why can we offer new perspective? • Strong engagement with industry • Users of cloud computing in research and teaching last 18 months • Goal: stimulate discussion on what’s really new • Without resorting to weather analogies ad nauseam
Utility Computing Arrives • Amazon Elastic Compute Cloud (EC2) • “Compute unit” rental: $0.10-0.80/hr. • 1 CU ≈ 1.0-1.2 GHz 2007 AMD Opteron/Xeon core • N • No up-front cost, no contract, no minimum • Billing rounded to nearest hour; pay-as-you-go storage also available • A new paradigm (!) for deploying services?
What Is it? What’s New? • Old idea: Software as a Service (SaaS) • Basic idea predates MULTICS • Software hosted in the infrastructure vs. installed on local servers or desktops; dumb (but brawny) terminals • Recently: “[HW, Infrastructure, Platform] as a service” ?? HaaS, IaaS, PaaS poorly defined, so we avoid • New: pay-as-you-go utility computing • Illusion of infinite resources on demand • Fine-grained billing: release == don’t pay • Earlier examples: Sun, Intel Computing Services—longer commitment, more $$$/hour, no storage • Public (utility) vs. private clouds
Why Now (Not Then)? • “The Web Space Race”: Build-out of extremely large datacenters (10,000s of commodity PCs) • Build-out driven by growth in demand (more users) • => Infrastructure software: e.g., Google File System • => Operational expertise: failover, DDoS, firewalls... • Discovered economy of scale: 5-7x cheaper than provisioning a medium-sized (100s machines) facility • More pervasive broadband Internet • Commoditization of HW & SW • Fast Virtualization • Standardized software stacks
Classifying Clouds • Instruction Set VM (Amazon EC2, 3Tera) • Managed runtime VM (Microsoft Azure) • Framework VM (Google AppEngine) • Tradeoff: flexibility/portability vs. “built in” functionality Lower-level, Less managed Higher-level, More managed EC2 Azure AppEngine
Cloud Economics 101 • Cloud Computing User: Static provisioning for peak - wasteful, but necessary for SLA Capacity Machines $ Capacity Demand Demand “Statically provisioned” data center “Virtual” data center in the cloud Time Time Unused resources
Cloud Economics 101 • Cloud Computing Provider: Could save energy Capacity Energy Machines Capacity Demand Demand “Statically provisioned” data center Real data center in the cloud Time Time Unused resources
Risk of Under-utilization • Under-utilization results if “peak” predictions are too optimistic Capacity Unused resources Resources Demand Time Static data center
Risks of Under Provisioning Resources Resources Resources Capacity Capacity Capacity Lost revenue Demand Demand Demand 2 3 2 2 3 3 1 1 1 Time (days) Time (days) Time (days) Lost users
New Scenarios Enabled by “Risk Transfer” to Cloud • Not (just) Capital Expense vs. Operation Expense! • “Cost associativity”: 1,000 CPUs for 1 hour same price as 1 CPUs for 1,000 hours (@$0.10/hour) • Washington Post converted Hillary Clinton’s travel documents to post on WWW <1 day after released • RAD Lab graduate students demonstrate improved Hadoop (batch job) scheduler—on 1,000 servers • Major enabler for SaaS startups • Animoto traffic doubled every 12 hours for 3 days when released as Facebookplug-in • Scaled from 50 to >3500 servers • ...then scaled back down
Hybrid / Surge Computing • Keep a local “private cloud” running same protocols as public cloud • When need more, “surge” onto public cloud, and scale back when need fulfilled • Saves energy (and capital expenditures) by not buying and deploying power distribution, cooling, machines that are mostly idle
Outline • Energy Proportionality vs. Reality • Turing Off vs. Ensuring Full ROI • Turning Off and Reliability • Defining Cloud Computing • RAD Lab Vision • Datacenter OS and Energy Efficiency • Datacenter Store and Energy Efficiency
RAD Lab 5-year Mission • Enable 1 person to develop, deploy, operate next -generation Internet application • Key enabling technology: statistical machine learning • debugging, power management, performance prediction, … • Highly interdisciplinary faculty and students • PI’s: Fox/Katz/Patterson (systems/networks), Jordan (machine learning), Stoica (networks & P2P), Joseph (systems/security), Franklin (databases) • 2 postdocs, ~30 PhD students, ~5 undergrads
Successes • Predict performance of complex software system when demand is scaled up • Automatically add/drop servers to fit demand, without violating Service Level Agreement (SLA) • Distill millions of lines of log messages into an operator-friendly “decision tree” that pinpoints “unusual” incidents/conditions • Recurring theme: cutting-edge Statistical Machine Learning (SML) works where simpler methods have failed
RAD Lab Prototype:System Architecture Web 2.0 apps Drivers Drivers Drivers Ruby on Rails environment web svc APIs Chukwa trace coll. local OS functions VM monitor SCADS Chukwa trace coll. local OS functions Chukwa & XTrace (monitoring) New apps, equipment, global policies (eg SLA) Offered load, resource utilization, etc. Director Training data performance & cost models Log Mining AutomaticWorkload Evaluation (AWE)
Automatic Management of a Datacenter • As datacenters grow, need to automatically manage the applications and resources • examples: • deploy applications • change configuration, add/remove virtual machines • recover from failures • Director: • mechanism for executing datacenter actions • Advisors: • intelligence behind datacenter management
Director Framework performance model workload model Advisor Advisor Advisor Advisor monitoring data config Director Drivers Datacenter(s) VM VM VM VM
Director Framework • Director • issues low-level/physical actions to the DC/VMs • request a VM, start/stop a service • manage configuration of the datacenter • list of applications, VMs, … • Advisors • update performance, utilization metrics • use workload, performance models • issue logical actions to the Director • start an app, add 2 app servers
What About Storage? • Easy to imagine how to scale up and scale down computation • Database don’t scale down, usually run into limits when scaling up • What would it mean to have datacenter storage that could scale up and down as well so as to save energy for storage in idle times?
SCADS: Scalable, Consistency-Adjustable Data Storage • Goal: Provide web application developers with scale independence as site grows • No changes to application • Cost / User doesn’t increase as users increase • Latency / Request doesn’t increase as users • Key Innovations • Performance safe query language • Declarative performance/consistency tradeoffs • Automatic scale up and down using machine learning (Director/Advisor)
Beyond 2/3 Energy Conservation Upper Bound? • What if heterogeneous servers in data center? • Performance nodes: 1U to 2U servers, 2-4 sockets, 16 GB DRAM, 4 disks • Storage nodes: 4U to 8U servers, 2-4 sockets, 32 GB - 64 GB DRAM, 48 disks (e.g., Sun Thumper) • 1 replica on Storage node, 2 or more replicas on Performance nodes • If 10 Watts / disk, 250W per node (no disks): 1*250 + 48*10 = 730 Watts • vs. 12*(250 + 4*10) = 3480 Watts • Could save 80% heterogeneous vs. 67% homogenous when trying to save power
Overall Power Savings? • Assumptions: Peak needs 10X servers, 50 hours per week is peak load, rest week 10% utilization (=> 2/3 power) • Homogeneous, Everything on power:50 hrs @ Full load + 118 hrs @ 67% load = 130 hrs @ Full load • Heteregeneous, turn off when load is low50 hrs @ Full load + 118 hrs * 10% servers @ 100% load = 62 hrs @ Full load • Saves 1/2 of power bill of data center
Conclusion • Long way before Energy Proportionality • ≈ ½ peak power when (benchmark) system idle • Scaling down helps energy conservation • Cloud Computing will transform IT industry • Pay-as-you-go utility computing leveraging economies of scale of Cloud provider • 1000 CPUs for 1 hr = 1 CPU for 1000 hrs • Cloud Computing offers financial incentive for systems to scale down as well as up • New CC challenges: Director, Scalable Store
The Million Server Datacenter • 24000 square meter housing 400 containers • Each container contains 2500 servers • Integrated computing, networking, power, cooling systems • 300 MW supplied from two power substations situated on opposite sides of the datacenter • Dual water-based cooling systems circulate cold water to containers, eliminating need for air conditioned rooms
2020 IT Carbon Footprint 820m tons CO2 360m tons CO2 2007 Worldwide ITcarbon footprint:2% = 830 m tons CO2 Comparable to theglobal aviation industry Expected to grow to 4% by 2020 260m tons CO2
Thermal Image of TypicalCluster Rack Rack Switch M. K. Patterson, A. Pratt, P. Kumar, “From UPS to Silicon: an end-to-end evaluation of datacenter efficiency”, Intel Corporation
DC Networking and Power • 96 x 1 Gbit port Cisco datacenter switch consumes around 15 kW -- approximately 100x a typical dual processor Google server @ 145 W • High port density drives network element design, but such high power density makes it difficult to tightly pack them with servers • Alternative distributed processing/communications topology under investigation by various research groups