Download
1 / 36
360 likes | 521 Vues
This study presents a comprehensive proposal for simultaneous observations of the blazar Mrk 421 across the electromagnetic spectrum utilizing INTEGRAL. The objectives include measuring time variability, spectrometry, and correlations in intensity spectra between X-ray and TeV gamma-ray emissions. Mrk 421, notable for its characteristic strong variability and intense activity, is a key target for understanding the emission processes in TeV blazars. The findings aim to shed light on the interconnected emission mechanisms and the relative properties in different spectral bands.

E N D
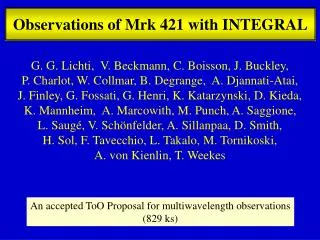
Observations of Mrk 421 with INTEGRAL G. G. Lichti, V. Beckmann, C. Boisson, J. Buckley,P. Charlot, W. Collmar, B. Degrange, A. Djannati-Atai,J. Finley, G. Fossati, G. Henri, K. Katarzynski, D. Kieda, K. Mannheim, A. Marcowith, M. Punch, A. Saggione,L. Saugé, V. Schönfelder, A. Sillanpaa, D. Smith,H. Sol, F. Tavecchio, L. Takalo, M. Tornikoski,A. von Kienlin, T. Weekes An accepted ToO Proposal for multiwavelength observations(829 ks)
Aim of the Proposal • To perform simultaneous or quasi-simulta-neous observations of Mrk 421 across the electromagnetic spectrum with the aim to measure • time variability • spectral characteristics/variability • intensity-spectrum correlations • to study the relative properties in different X-ray bands and between X/γ-rays and TeV quanta
Mrk 421 is a TeV blazar • TeV blazars are AGN of the BL Lac type • radio-loud sources • high polarization at radio & optical wavelengths synchrotron radiation • strong variability at all wavelengths • 6 TeV blazars so far firmly detected • spectral characteristics • non-thermal emission processes • 2 smooth broadband-emission components • emission from a narrow relativistic jet observed under a small angle (energy flux in the jet: 1044 – 1047 erg/s)
Schwarzschildradius:Rs = (3.9 - 15.8) AU M = (2-8) · 108 M radius of last stable orbit:r = 3Rs = (11.8 – 47.4) AU Parameters of Mrk 421(z = 0.031 dl 130 Mpc) Keplervelocity at r:v = 0.41 · ctrot = 25 h – 4.2 d
relativistic-moving blobsof Leptons or Hadrons TeV blazars Structure of a TeV Blazar
synchrotronemission IC emission 414MeV 4 keV 4 TeV Spectrum of TeV Blazars X-ray and TeV emission time variability correlates same e- population
e- + magnetic fields synchrotron radiation e- + photons IC emission Emission Processes Origin of photons forIC scattering:- synchrotron photons- thermal photons from disk- scattered photons from clouds However:Lack of strong emissionlines in BL Lac favourSSC models
IBIS JEM-X SPI SPI sensitivityfor 3σ detection The transition region when Mrk 421 is active JEM-X will detect Mrk 421 with 10σ in ~5000 s! SPI detects the active Mrk 421 in the40-100 keV band with 10σ in <104 s
Lightcurves of Mrk 421 from the ASM of RXTE 30 mCrab Points in red are >3σ detections!
50 – 100 keV 20 – 50 keV 100 – 150 keV 160 σ 8.7 σ 39.7 σ Preliminary ISGRI Maps NGC 4151
steep rise(2.9 h) [°] June 25 June 14 The Lightcurves of ISGRI (20-80 keV)
[°] June 14 June 25 The Lightcurves of JEM-X (3-20 keV)
N Mrk 421 nearbystar(V=6) 2` ~15 min Optical Images of the OMC Although a bright star is closeby the photometry of Mrk 421can be performed with theOSA analysis tools. Lightcurves with a high resolutionare available from the OMC!
Preliminary Emission-Region Constraintsfrom INTEGRAL Observations Shortest variability time scale: 2.9 hours size of emission region δ = Doppler factor ( 10)z = 0.031 (redshift)c = speed of light l < 3 · 1015 cm = 203 AU for Θ 0° β > 0.98
Smallest variability time scale ~30 minutes Time Variability of Mrk 421 at TeVEnergies CAT lightcurve at TeV energies (1999-2000) Mrk 421 shows a very errratic timingbehaviour and a strong flaring activity emission region < 3.6 AU
Whipple observations X-ray & TeV flares occurred simul-taneously to within 1.5 hours BeppoSAX observations Lightcurves at X-Ray & TeV Energies Flare at TeV and X-ray energiesnearly coincident same electron population respon-sible for X-ray and γ-ray radiation? from Maraschi et al., Ap. J. 526, L81, 1999
Δt 5 days of RXTE: 2-60 keV Correlation between X-ray and TeV γ-ray lightcurves(after Blazejowski et al., Ap. J. 630, 130, 2005) X-ray and TeV γ-ray intensitycorrelate, yet only loosely! However:The X-rays lag behind the TeV γ-rays in contradiction to the SSC model!
Time Lags • time lags between X- and γ-rays can help to distinguish between SSC & EC models • SSC: Δt R · c-1 · δ-1 ( 2.8 hours) • synchrotron photons immediately emitted • IC photons only after these photons were distributed over emission volume • EC: Δt 0 s • observations so far inconsistent! • however high-energy X-rayslag the softer ones (in agree-ment with pumping e- to higherenergies)! (Fossati et al., Ap. J.541, 153, 2000)
Energy Dependence of Time Lags at X-Rays ASCA data show: soft X-rays (0.5-2 keV)lag the X-rays from2-7.5 keV Interpretation:radiative cooling of e-! However reality of thesetime lags questioned! from Takahashi et al.,Ap. J. 470, L89, 1996
4-15 keV rising phase hardening softening decay phase Evolution of the X-Ray Photon Indices Higher fluxes haveflatter (harder) spectra! The evolution of the spectrumis dictated by the interplay of acceleration, cooling and con-finement times. The clockwiseevolution is consistent withstochastic Fermi accelerationand synchrotron cooling.
Preliminary JEM-X & ISGRI Spectrum F = A·E-n·exp(-E/Ecut)A = 0.28 ± 0.02n = 1.91 ± 0.03 Ecut = (98 ± 16) keV
x Emission Maximum at X-ray Energies For a spectrum with exponential cut off theemission-maximum energy Ep is given by: Ep = (2 – n) • Ecut Inserting the values from above one obtains: Ep = (8.8 3.3) keV This is an averaged value over the whole observation.It is the highest peak energy ever measured for Mrk 421! Ep correlates nicely with the bolometric energy (BeppoSAX data from Massaro et al., Ap. J. 413, 489, 2004): Total bolometric luminosity:~1045 erg/s
Different Fits to the Spectral Shape Neither the spectra at X-ray nor at TeV energies can be fitted with a simple power law complexer spectral shapes have to be used X-ray data of BeppoSAX(Massaro et al., A&A 413, 489, 2004) TeV data(Aharonian et al., A&A 350, 757, 1999)
Analyticalfit functions at TeV energies Krennrich et al. (Ap. J. 560, L45, 2001) performed fits to TeV dataof Mrk 421 with different analytical functions: Power laws do not fit the spectra very well: χ2red = 41 χ2red = 6.3 The TeV data of Mrk 421can be well fitted by apower law with an expo-nential cut off! χ2red = 2.8 χ2red = 3.0
Analyticalfit functions at X-rays However at X-rays a power law with exponential cut off doesnot fit the data well! Fossati et al. (Ap. J. 541, 166, 2000) used a continuous combination of 2 power laws: m & n are thepower-law indices forE >> E0 and E << E0, respectively. Since this model has 5 parameters which cannot simply be re-lated to physical quantities a log-parabolic function was used: Fixing the energy E0 at a useful energy(in the middle of the considered energyrange) this function has only 3 parameters.
Properties of the log-parabolic function Calculation of the peak energy ofthespectral energy density νFν The spectral energydensity at Ep: The log-parabolic function can be analyticallyintegrated leading to the bolometric luminosity: Limitation of the function: restricted to symmetric distributions!
Relation of spectral shape with acceleration process Assumption:p = probability of a particle to gain an energy ε in an acceleration step iγi = ε · γi-1 = ε · ε · γi-2 = · · · · · · = εi · γo (ε > 1 & independent of energy)Ni = p · Ni-1 = p · p · Ni-2 = · · · = pi · No (p < 1 & independent of energy) Eliminating i yields:
Derivation of log-parabolic spectrum g, q > 0 andconstant Assumption: p depends on energy: The probability for particle acceleration decreases with increasing energy! Using γi = ε · γi-1 one obtains:
data from 1999 0.414 keV 41.4 keV Log-parabolic law Inserting i = log(γ/γ0)/logε onegets after some lengthy calcula-tions a log-parabolic law: Comparison with BeppoSAX datashows good agreement (Fossati et al.,A&A 413,489, 2004)Shift of Ep clearly seen!
Still log-parabolic law It can be shown analytically thata and b are linearly correlated.This is supported by BeppoSAX data!(Massaro et al., A&A 413, 489, 2004) Most synchrotron spectra of BL lacs are curved (due to radiativelosses and escape of high-energy electrons from emitting region).
Deabsorbed TeV spectrum of Mrk 421 for 2 states measured spectrum 0.41 1.31 4.14 TeV 13.1 TeV Absorption of TeV γ-rays atintergalactic photon field 300 GeV – 20 TeV γ-rays interact mostefficiently with IR photons (1 – 50 µm)via γTeV + γIR e+ e- Fmeas
Cosmic Infrared Background • Absorption effects of TeV quanta allow themeasurement of the cosmic IR/optical back-ground radiation • closely related to the total electromagnetic luminosity of the universe since decoupling time (~380 000 years) • cut-off energy of Mrk 501 and Mrk 421 is different (6.2 & 3.1 TeV, respectively) cut off in Mrk 421 intrinsic and not due to cosmic IR absorption (since both at same z)!
Some Open Questions • How is the spectral transition from the low-energy component to the high-energy component? • What are the seed photons for the inverse Compton effect? • internal seed photons or • external seed photons?Information from spectral shape at X-ray & TeV energies! • What is the nature of the accelerated particles (Leptons or Hadrons)? (different Larmor radii for e- & p lead to different time scales) • Are the X- and -ray flaring events related to optical variations? • Why is the spectral shape at TeV energies different at the various activity states (intensity-spectral-shape correla-tion)?
Goal of the Proposal • Measurement of the drop off at X-ray & TeV energies • hint about source of seed photons • shape yields information about radiative energy losses • traces maximum energy of accelerated particlesthus yielding information about the acceleration processes • Measurement of the variability time scale distinction between hadronic and leptonic models • organisation of simultaneous measurements at all wavelengths
Synchrotronradiation Synchrotronself-Compton Energy range of IBIS and SPI (~4.8 • 1018 Hz < < ~1.9 • 1021 Hz) Sensitivity limit of SPI (for 800 ks) Multiwavelength Spectrum of Mrk 421