Download
1 / 1
30 likes | 179 Vues
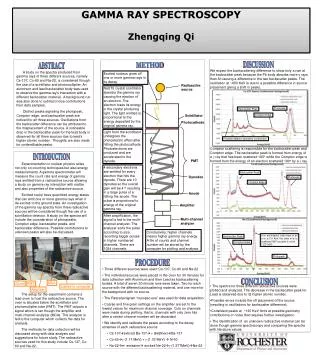
MCA. Oven. PMT. Cables to computer. Amplifier. GAMMA RAY SPECTROSCOPY Zhengqing Qi. DISCUSSION. METHOD. ABSTRACT.

E N D
MCA Oven PMT Cables to computer Amplifier GAMMA RAY SPECTROSCOPY Zhengqing Qi DISCUSSION METHOD ABSTRACT We expect the backscattering difference to show only a rise at the backscatter peak because the Pb body absorbs more γ rays than Al causing a difference in the two backscatter peaks. The oscillation at ~650 KeV is due to a possible difference in source placement giving a shift in peaks. A study on the spectra produced from gamma rays of three different sources, namely Cs-137, Co-60 and Na-22, is considered though the use of a scintillator and photomultiplier. An aluminum and lead backscatter body was used to observe the gamma ray’s interaction with a different backscatter material. A background run was also done to subtract noise contributions from data samples. Distinct peaks signaling the photopeak, Compton edge, and backscatter peak are noticed for all three sources. Oscillations from the backscatter difference can be attributed to the misplacement of the source. A noticeable drop in the backscatter peak for the lead body is observed for all three sources due to lead’s higher atomic number. Thoughts are also made for unidentifiable peaks. Excited nucleus gives off one or more gamma rays in its decay. Radioactive source NaI(Tl) crystal scintillator absorbs the gamma ray causing the ejection of an electron. The electron loses its energy in the crystal producing light. The light emitted is proportional to the energy deposited by the original gamma ray. Photopeak Backscatter Peak Compton Edge Scintillator Photocathode Light from the scintillator undergoes the photoelectric effect after hitting the photocathode. Photoelectrons are produced and are accelerated to the dynode. Possible detector geometry contribution Compton scattering is responsible for the backscatter peak and Compton edge. The backscatter peak is formed from energy of a γ ray that has been scattered 180o while the Compton edge is formed from the energy of an electron scattered 180o by a γ ray. INTRODUCTION PMT Experimentation in nuclear physics relies not only on counting techniques but also energy measurements. A gamma spectrometer will measure the count rate and energy of gamma rays emitted from a radioactive source allowing a study on gamma-ray interaction with matter and also properties of the radioactive source. Excited nuclei have quantized energy states that can emit one or more gamma rays when it de-excites to the ground state. An investigation of the gamma ray spectra from three radioactive sources will be considered though the use of a scintillation detector. A study on the spectra will include the consideration of photopeaks, Compton edge, backscatter peaks, and backscatter difference. Possible contributions to unknown peaks will also be discussed. The setup for the experiment contains a lead oven to host the radioactive source. The oven is situated below the scintillator and photomultiplier tube (PMT). The PMT outputs a signal which is ran though the amplifier and multi-channel analyzer (MCA). The analyzer is fed to the computer which collects the data for analysis. The methods for data collection will be discussed along with data analysis and suggestions for future study. The radioactive sources used for this study include Cs-137, Co-60 and Na-22. 4 secondary electrons are emitted for every electron that hits the dynode. There are 10 dynodes so the overall gain will be 410 resulting in a large pulse of e- hitting the anode. The pulse is proportional to energy of the original gamma ray. Backscatter Peak Dynodes Photopeak Compton Edge Anode Amplifier After amplification, the signal is fed to the multi-channel analyzer. The analyzer sorts the pulse according to size, recording bigger pulses in higher numbered channels. There are 1024 channels. Multi-channel analyzer Conclusively, higher channels means higher gamma ray energy. A file of counts and channel number will be stored by the computer for plotting and analysis. e+/e- annihilation (rest mass of an e+/e- is 511 KeV, the other e+/e- is scattered 180o so peak is not at 1.22 GeV) Backscatter Peak Compton Edge Photopeak PROCEDURE • Three different sources were used: Cs-137, Co-60 and Na-22 • The individual sources were placed in the oven for 30 minutes for data collection with Aluminum and then Lead as backscattering bodies. A total of seven 30 minute runs were taken. Two for each source with the different backscattering material, and one more for the background with no source. • The Pascal program “nucspec.exe” was used for data acquisition. • Coarse and fine grain settings on the amplifier are set to the lowest values for maximum channel coverage. Cuts on channels were made during plotting, that is, channels with only zero hits after a certain channel number will be discarded. • We identify and calibrate the peaks according to the decay schemes of each radioactive source: • Cs-137exticed Ba-137 γ (662Kev)Ba-137 • Co-60γ(1.17 MeV) + γ(1.33 MeV) N-60 • Na-22e+ emission excited Ne-22γ(1.277MeV)Ne-22 CONCLUSION • The spectra for three different radioactive sources were plotted and analyzed. The decrease in the backscatter peak for Lead is observed due to its higher atomic number. • Possible errors include the off placement of the source (resulting in oscillations for backscatter difference). • Consistent peaks at ~130 KeV hints at possible geometry contributions or noise that requires further investigation. • The identification of an unknown radioactive material can be done though gamma spectroscopy and comparing the spectra with literature values.