Download
1 / 59
720 likes | 1.02k Vues
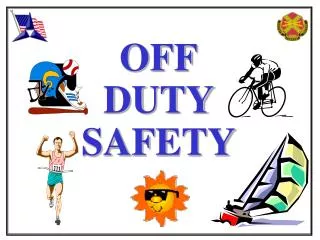
Promoting Off-the-Job Safety: It Makes $ense!. [Insert your company name or logo here and delete this text.]. June 2009. Off-the-Job Injuries: What’s the national situation?. Sources. Injury Facts® 2009 Edition Most current data available – 2007, 2006, or 2005 – depending on the source.

E N D
Promoting Off-the-Job Safety:It Makes $ense! [Insert your company name or logo here and delete this text.] June 2009
Sources • Injury Facts® 2009 Edition • Most current data available – 2007, 2006, or 2005 – depending on the source
What does “off-the-job” mean? • Not on the job • Includes – • People employed (full- or part-time) but not at work • Excludes – • Children • Persons keeping house full time • Retired • Unemployed • Other persons not in the labor force
“Off-the-job” or “non-work” injuries? • Off-the-job includes the part of • Motor-vehicle • Home and Community involving workers away from work • Non-work includes all of • Motor-vehicle • Home and Community
Off-the-Job Challenge • 147 million workers at risk • 52,500 worker OTJ deaths • 9.4 million worker OTJ disabling injuries • $246.8 billion in OTJ costs to society Source: Injury Facts, 2009 Ed.
On-The-Job 147 million workers at risk 4,689 on-the-job deaths 3.5 million disabling injuries $175.3 billion in costs to society Off-the-Job 147 million workers at risk 52,500 worker OTJ deaths 9.4 million worker OTJ disabling injuries $246.8 billion in OTJ costs to society OTJ Compared to On the Job Source: Injury Facts, 2009 Ed.
Off vs On-the-Job Deaths – 11:1 Source: Injury Facts, 2009 Ed.
Off vs On-the-Job Injuries – 3:1 Source: Injury Facts, 2009 Ed.
Off vs On-the-Job Costs Source: Injury Facts, 2009 Ed.
Unintentional Injuries • 120,000 deaths • 3.0 million hospitalized • 6.4 million outpatient department visits • 26.3 million disabling injuries • 27.6 million emergency department visits • 49.2 million physicians’ office visits Source: National Safety Council and National Center for Health Statistics
Unintentional Injuries • Each year 1 in 9 people seek medical attention for an injury Source: National Center for Health Statistics
Costs of Injuries • $684.4 billion • $5,900 per household • $2,300 per person • Paid… • directly out of pocket, and • higher prices for goods and services, and • higher taxes Source: Injury Facts, 2009 Ed.
Unintentional Injuries • #1 cause of death for people 1 to 41 years old • #5 cause of death for all ages Source: Injury Facts, 2009 Ed.
Leading Causes of Death, 2005 Heart disease 652,091 Cancer 559,312 Stroke 143,579 Chronic lower respiratory disease 130,933 Unintentional injuries 117,809 Diabetes mellitus 75,119 Source: National Center for Health Statistics
Average Age at Death andRemaining Lifetime * Chronic Lower Respiratory Disease Source: NSC estimates based on 2005 NCHS data.
What the previous graph means • People who die from unintentional injuries are, on average, 20 to 25 years younger than people who die from other leading causes of death. • They are still working. • They are still raising families. • They would have lived, on average, another 27 years.
Unintentional-Injury Deaths Source: Injury Facts, 2009 Ed.
Nonfatal Injuries Source: Injury Facts, 2009 Ed.
Unintentional Injury Costs Source: Injury Facts, 2009 Ed.
The Off-the-Job Challenge • What are the priority safety issues?
302 Million People at Risk • 43,100 people killed in crashes • 2.3 million disabling injuries • $257.7 billion in costs to society Source: Injury Facts, 2009 Ed.
Motor-Vehicle Deaths Source: Injury Facts, 2009 Ed.
Highway Safety Issues • Driver skills, attitudes & behaviors • >60% of crashes • Alcohol • 12,988 alcohol-impaired deaths • Occupant protection • >12,252 deaths of unrestrained occupants Note that there is some duplication among these categories.
Highway Safety Issues • Driver skills, attitudes & behaviors • Distracted Driving • Young Drivers • Alcohol • Lack of occupant protection • Large trucks – 4,800 deaths • 3,600 are occupants of other vehicles • Pedestrians – 5,900 deaths
Highway Safety Issues Young Drivers Elderly Drivers Source: NHTSA Research Note. Crash Data and Rates for Age-Sex Groups of Drivers, 1996. January 1998.
Home & Community Venue • 74,000 deaths • 20,600,000 disabling injuries • $273 billion • 116 million households Source: Injury Facts, 2009 Ed., and US Census Bureau
Home & Community Deaths Source: Injury Facts, 2009 Ed.
Home & Community Deaths Source: Injury Facts, 2009 Ed. *Inhalation or ingestion of food or object.
Risk Factors – Falls • Age – young, old • Coordination • Resistance to injury • Environmental conditions • Hard surfaces • Slippery surfaces, footwear • Unstable walking/working surfaces • Unguarded heights
Risk Factors – Poisoning • Accessibility of substances • Overdose or improper use of medications • Taking with alcohol • Use of illegal drugs
Risk Factors – Drowning • Falling into water • Unable to swim • Hypothermia • Exhaustion • Water speed and depth
Risk Factors – Choking • Alcohol use • Dentures • Problems chewing/swallowing • Small parts, food pieces
Risk Factors – Fires • Lack of working smoke detectors • Improper use of smoking materials • Unattended cooking • Faulty heating equipment • Age – young, old
Risk Factors – Burns • Domestic hot water • Hot objects, steam • Flammable fabrics • Alcohol use
Recent Trends Death Rate Indexes (1992=100) Workplace death rate* down 24%. *Deaths per 100,000 workers. Source: Injury Facts, 2009 Ed.
Recent Trends (Cont.) Death Rate Indexes (1992=100) Highway death rate* down 21%. *Deaths per 100 million vehicle-miles traveled. Source: Injury Facts, 2009 Ed.
Recent Trends (Cont.) Home & Community death rate* up 45%. Death Rate Indexes (1992=100) *Deaths per 100,000 population. Source: Injury Facts, 2009 Ed.
Recent Trends (Cont.) Death Rate Indexes (1992=100) Total U-I death rate* up 17%. *Deaths per 100,000 population. Source: Injury Facts, 2009 Ed.
Off-the-Job Injuries:What’s the situation in [insert your company name]?
Insert new slides here to present data on OTJ injuries in your own company. Follow the examples of slides used for national data earlier in the presentation or make up new slides.
Lost workday case incidence rate - On the job injury # LWD cases x 200,000 LWDCI Rate = # Employees hours worked • LWD cases – workplace injuries resulting in lost or restricted work activity in one year • Employee hours worked - total number of hours worked by all employees in one year • 200,000 – equivalent of 100 full-time employees working 40 hours/week, 50 weeks/year
Lost workday case incidence rate – OTJ injury # LWD-OTJ cases x 200,000 LWDCI-OTJ Rate = # Employees x 3,744 • LWD-OTJ cases – off-the-job injuries resulting in lost or restricted work activity in one year • 200,000 – equivalent of 100 full-time employees working 40 hours/week, 50 weeks/year • 3,744 – nonwork exposure hours per year per employee
Employer Costs per Employee • Occupational injuries – $2,062 • Off-the-job injuries – $822 • Total on- and off-the-job – $2,885 • 29% is off-the-job costs Source: Miller, T.R. (1997). JSR, 28(1), 1-13. Adjusted to 2005 dollars.