Download
1 / 24
240 likes | 376 Vues
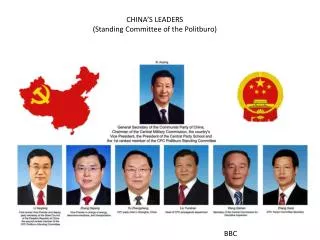
New Politburo Standing Committee. Xi Jinping, General Secretary of CCP PRINCELING Li Keqiang, Premier of State Council YOUTH LEAGUE Zhang Dejiang, Head, NPC PRINCELING Yu Zhengsheng, Head, CPPCC PRINCELING Liu Yunshan, Head, CCP Propaganda YOUTH LEAGUE Wang Qishan, Head, CCP Disc. Insp.

E N D
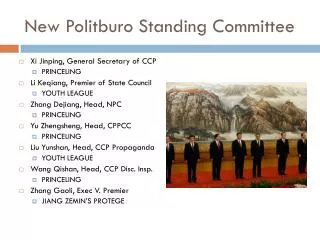
New Politburo Standing Committee • Xi Jinping, General Secretary of CCP • PRINCELING • Li Keqiang, Premier of State Council • YOUTH LEAGUE • Zhang Dejiang, Head, NPC • PRINCELING • Yu Zhengsheng, Head, CPPCC • PRINCELING • Liu Yunshan, Head, CCP Propaganda • YOUTH LEAGUE • Wang Qishan, Head, CCP Disc. Insp. • PRINCELING • Zhang Gaoli, Exec V. Premier • JIANG ZEMIN’S PROTEGE
China's Impact on Global Poverty, 1987-1998 • World Bank's PPP$1/day consumption poverty line • Change in global number of poor (%) = - 0.6 • Excluding China = + 9.3
Acknowledgements • Data source • Rural Education Action Project • Stanford University • Prof. Scott Rozelle
Comparative Context • Hourly wages, 1990s (US$/hour) • US $24 • Japan $22 • Korea $14 • Brazil $4 • Mexico $3 • China $1 Headline: “China is Eating Mexico’s Lunch” Note: job competition among low-wage platforms
Comparative Context: Korea • Hourly wages, 1990s (US$/hour) • US $24 • Japan $22 • Korea $14 1970/80s ~$1 • Brazil $4 • Mexico $3 • China $1 Korea transformation from low-wage, labor-intensive jobs to higher-wage, higher-productivity, higher-tech jobs
Comparative Context: Korea • Korea’s high school graduation rates by 1980s • Urban • Close to 100% • Rural • Close to 100%
Comparative Context: Mexico • Hourly wages, 1990s (US$/hour) • US $24 • Japan $22 • Korea $14 • Brazil $4 • Mexico $3-4 1970s ~$1 • China $1 Mexico low-wage, labor-intensive jobs But where is the transformation?
Comparative Context: Mexico • Mexico’s high school graduation rates by 1980s • Urban • ~80% • Rural • ~40%
Comparative Context • Inequality, Gini coefficients • Korea 32 gap • Brazil 54 • Mexico 52
Comparative Context: China • Hourly wages, 1990s (US$/hour) • US $24 • Japan $22 • Korea $14 • Brazil $4 • Mexico $3 • China $1 China Can China make the transformation from low-wage, labor-intensive jobs to higher-wage, higher-productivity, higher-tech jobs?
China’s Population: Urban, Rural, and Poor Rural • ≈ 35% of school-aged children in poor rural areas (> 50 million children, ages 6 to 15) cities other rural Source: Scott Rozelle, REAP, Stanford
Annual Real Hourly Wage (1978 dollars) Starts rising 1998 ≈ $2.00 / hour in 2010 Unskilled wage ≈ 30 ¢ / hour in 1978 Park and Cai, 2008; Rozelle (REAP) 2012
Comparative Context: China • China’s high school graduation rates by 1980s • Urban • Close to ~85% • Rural • Close to ~40% • China’s profile is more similar to Mexico’s than Korea’s
Comparative Context: China • China’s middle school completion rates • Poor rural areas (35% of school-aged children) • ~60%
Comparative Context: China • Inequality, Gini coefficients • Korea 32 gap • Brazil 54 • Mexico 52 • China 50
Development policy areas • Education • Other policy areas • Health • Rural infrastructure
Development policy areas • Health • As of 2000, ~80% of people in rural China • Without health insurance of any kind • 2003 new Rural Cooperative Medical Scheme • As of 2007, implemented in 86% of counties • Has not significantly reduced out-of-pockets expenditure • Has not significantly increased use of formal medical services
Development policy areas • Rural infrastructure • Roads • Drinking water • Poorest rural areas now receiving more inter-governmental fiscal transfers from above • Brandt
Development policy areas: InfrastructureIntergovernmental fiscal transfers to support rural tax/fee reform (equalizing)
Comparative Context • Developmental challenges facing rural China • Infrastructure • Health • Education
Questions for Discussion • Analyze Figure 3.1a. Do respondents perceive much inequality close to home? • Analyze Figure 3.2a. What are the 2 most important reasons respondents give for why people are poor? 2 least important reasons? • Analyze Figure 3.2b. What are the 2 most important reasons respondents give for why people are rich? 2 least important reasons? • What do Whyte’s findings suggest about the world view/ideology of survey respondents? • Do you agree with the majority of respondents in this survey?