Download
1 / 20
200 likes | 335 Vues
This study investigates the relationship between flood characteristics and mortality in New Orleans following Hurricane Katrina. It uses methodologies developed in the Netherlands to analyze data on flood depth, velocity, and population exposure. The research highlights significant mortality rates in areas with deep flooding and near levee breaches, totaling 1,118 fatalities in Louisiana. The evacuation rate was estimated at 80-90%, with 10% of the population exposed to flooding. Recommendations for further data analysis and comparisons with other risk assessment methods are provided.

E N D
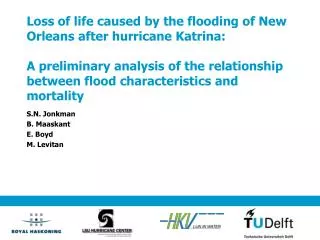
Loss of life caused by the flooding of New Orleans after hurricane Katrina:A preliminary analysis of the relationship between flood characteristics and mortality S.N. Jonkman B. Maaskant E. Boyd M. Levitan
Background • Methods for estimation of loss of life are used to: • Assess consequence and risk levels • Analyse mitigation strategies • A method has been developed for Netherlands, mainly based on Dutch 1953 data • Objective: analyse relationship between flood characteristics and mortality for New Orleans • Focus on direct mortality in flooded area
Analysis of mortality • Analyse flood characteristics • Estimate exposed population (incl. evacuation) • Analyse relationship between flood characteristics and mortality Mortality (=nr. of fatalities/nr. exposed)
Flood simulations • 2D Hydrodynamic simulations • To give insight in: depth, velocity, rise rate, arrival time Input information: • Breach characteristics (location, size, timing) • Digital elevation model • Hydraulic roughness • Results compared with: flood maps, damage patterns, eyewitness accounts
Flood simulation Simulations by Bob Maaskant (TU Delft) and WL|Delft Hydraulics
Affected population and evacuation • Flooded area: 450,000 inhabitants • Evacuation rate: 80% to 90% ((Wolshon, 2006) based on traffic counts) • Shelter in city (Superdome etc.) 10% • Estimate: 10% of population was ‘exposed’ to flooding
Data regarding Katrina related fatalities • Source: State Louisiana DHH in cooperation with LSU Hurricane Center • Total: 1118 fatalities in Louisiana • Recovery locations geocoded for 771 victims (69%) • Dataset also provides information on: • Age (elderly!) • Gender (50%-50%) • Ethnicity (similar to original population) • Type of structure / facility
Recovery locations ` Source: State of Louisiana DHH & LSU Hurricane Center
Breach zone: Lower 9th Ward Building damage Flood characteristics • Many fatalities (75) near the Lower 9th Ward breaches • Characterised by building collapse and hv>5m2/s
Concluding remarks • Overall event mortality (1%) comparable to historical events • 2/3 of the fatalities associated with physical impacts of the flood • Mortality rates were highest in areas with large water depths and near breaches • Relationship between flood characteristics and mortality was found (but no influence of rise rate) Recommendations • Further analysis of mortality and population data is recommended • Comparison with other methods (e.g. IPET) • Application in consequence and risk assessments