Download
1 / 43
430 likes | 539 Vues
Toronto I-II 4:00 pm The use and misuse of cohort studies in guiding care . Moderator: Colin Kovaks Assistant Professor, Department of Medicine, University of Toronto, and a primary care physician currently practicing at the Maple Leaf Medical Clinic in Toronto. Jens Lundgren

E N D
Toronto I-II 4:00 pm The use and misuse of cohort studies in guiding care Moderator: Colin Kovaks Assistant Professor, Department of Medicine, University of Toronto, and a primary care physician currently practicing at the Maple Leaf Medical Clinic in Toronto Jens Lundgren Professor in the Department of International Health, Immunology and Microbiology at the University of Copenhagen and coordinator of theDAD study (Data Collection on Adverse Events of Anti-HIV Drugs)
Use (and misuse) of cohort studies to inform treatment decisions OHTN Research Conference 2013, Toronto 17th November 2013 Professor Jens D. Lundgren MD DMSc Copenhagen HIV Programme Department of Infectious Diseases, Rigshospitalet, University of Copenhagen Denmark
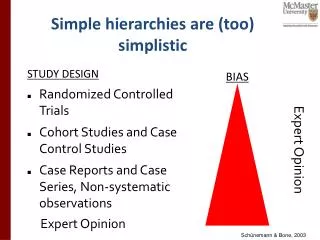
We all know ! • Zidovudine monotherapy should be used in early HIV • ART should be deferred to CD4 < 200 cells/µL • ART interruptions are healthy • d4T + ddI is a atoxic combination of ARV’s • IL-2 should be provided to well suppressed pts remaining with a low CD4 count • Tenofovir does not adversely affect kidney function • Atazanavir/r causes no other adverse drug reaction that increased levels of bilirubin Expert opinion is a hall-mark of HIV medicine ! Error rectified by continued research
HIV epidemic in eastern Europe and central Asia the fastest growing in the world:Estimated number of people living with HIV in WHO-EURO Region, 1990-2011 WHO European Region (total estimated) 2.4 million Eastern Europe and central Asia 1.5 million Western and central Europe 860 000 Source: UNAIDS. Global report: UNAIDS report on the global AIDS epidemic 2012.
The number of new cases of HIV infection in Russian citizens, 1987 - 2009 * *: numberscontinue to increase in 2010/11 (app 70,000) 20-25 million HIV tests per year – www. hivrussia.org UNAIDS Country Report
Infection increasing faster than treatment:WHO European Region, 1985–2011 (diagnosed) Sources: ECDC/WHO. HIV/AIDS surveillance in Europe 2011. Stockholm: ECDC; 2012; Federal Scientific and Methodological Center for the Prevention and Control of AIDS, Russian Federation; Ukrainian AIDS Centre, Ukraine; WHO/UNICEF/UNAIDS monitoring and reporting on the Health Sector Response to HIV/AIDS.
Treatment cascade in Europe *: incomplete data on number of persons in care in Eastern Europe
Durability of HIV suppression*: the key indicator to benchmark for good ART care • *: % of follow-up (FU) on ART where >90% FU has VL < 500 EuroSIDA (unpublished)
Late presentation by year of presentation Crude odds ratio 0.96 (0.95 – 0.97) per calendar year Crude odds ratio 0.95 (0.94 – 0.96) per calendar year Crude odds ratio 0.94 (0.93 – 0.95) per calendar year Crude 4.4 (3.8 – 5.0/mm3) per year increase in CD4 at presentation Median CD4 at presentation Proportion Year of presentation N 7367 7404 8046 7756 8591 8663 8251 8618 9057 7548 3223 LP : CD4 < 350/AIDS; advanced immunodeficiency : CD4 < 200/AIDS COHERE: Mocroft et al, PLoS Med 2013
Testing strategies • Existing approach • Self referral • Selected clinics in health system (ID, STD) • Future approach • Community testing (ensure transferral to care) • Provider-initiated testing • Indicator conditions (in any clinic or general practitioner seeing persons with such conditions) • Mononucleose-like illness, TB, viral hepatitis, STD, psoriasis, cervical dysplasia, esophagealcandidiasis, malignant lymphoma, etc
Focus to get general practitioners to test persons presenting with indicators routinely
Guidelines Changebut not in Synchrony 2013 De Cock & El-Sadr, NEJM 2013
When to START ART ?Benefit toIndividual vsindividuals sexual partner vssocietal benefit
Use of ART to reduce transmission:CD4 threshold vs coverage • Main determinant is coverage • If all infected on ART - very few transmissions • Realistic goal: rate of reproduction should be below 1 • Required coverage remains to be defined • If most transmissions occur prior to diagnosis, elevating CD4 count for when to start ART will not be effective • Testing strategies are critical • If source of infection is often very recently infected persons, not even the best testing strategy will work
Potential impact of cART on epidemic Granich RM et al. Lancet 2009
Potential impact of cART on epidemic Granich RM et al. Lancet 2009;373:48-57; Montaner JS. TasP-Workshop, Vancouver 2012.
Early vs delayed* ART of HIV+ persons living in sexualrelationshipwith HIV- person: HPTN 052 Risk of HIV infection for HIV neg Most : Heterosexual Reported use of condoms Uknowns from study: IDU ? No condoms ? MSM ? Population benefit ? HR=0.11 (0.04-0.33) In 28 of 38 infections, virus was genetically linked to virus from HIV+ *: Early = CD4 350-550 cells/µL; delayed = CD4 < 250 cells/µL Cohen et al, NEJM 2011
HIV among MSM in the UK – increasingincidencedespiteextensive ART coverage • Observed increases in HIV incidence in last 10 years despite gradual larger ART coverage • More condom-less sexual behaviour Phillips et al. PLoS One 2013
HIV incidence in the UK among MSM:observed or if condom use ceased in 2000 Incidence (per 100 person- years) Without condom use from 2000 Observed 1980 1985 1990 1995 2000 2005 2010 Phillips et al. PLoS One 2013
5% 4% 3% 2% 1% 0% 0 2 4 6 8 10 12 14 16 18 20 When does HIV transmission occur?The role of primary HIV Infection Transmission riskper sexual act Weeks after infection Pilcher et al JID 2004; 189:1785–92
HIV among MSM in the UK – source of most new infectionsare from undiagnosed men:more testing = less new infections • Observed increases in HIV incidence in last 10 years despite gradual larger ART coverage • More condom-less sexual behaviour • Source of new infections in 2010: • 82% undiagnosed infection; diagnosed ART naive 10%, diagnosed ART experienced 7% • If testing frequency increased to 68% of all MSM/yr (compared with currently 25%/yr) • Incidence projected to be reduced by 25% Phillips et al. PLoS One 2013
Natural history of HIV: CD4 count distribution according to time from infection CASCADE: Lodi et al; JID 2011
First, do no harm • Primum non nocere • The doctor should not prescribe medications unless s/he knows that the treatment is unlikely to be harmful • Doctor oath, year 1200
The case whyearly ART maycause net harm ? • Low risk of morbidity and mortality in early HIV without ART • In particular among younger persons • Overrepresented among persons with early HIV • If ART is of benefit, high NNTB • ART may adversely affect several organ functions • Risk is low – high NNTH • If NNTH > NNTB = ART of net harm • If correct (we will know in next 3-4 yrs) – major implications
HPTN 052 Update: Grinsztejn et al, WAC, July 2012 HR =1.37 ( 0.97 - 1.93 ) ART Initiation in Delayed Arm: 24% - CD4 count 229 (IQR: 197-249)
It is the deferralstrategythatdefines the result of a RCT of WTS ART (not the immediate) http://www.biomedcentral.com/1741-7015/11/148
Characteristics at entry and deferral strategies from RCTs comparing deferred vs. immediate initiation of ART in ART-naive HIV+ persons
When to start ART ?Ability to provide a safe deferral strategy 1 Rosen et al, Plos Med 2011; Severe et al, NEJM 2010
Survival after ART initiated at different CD4 count levels between 200-500: ”causal” modelling Proportion surviving The HIV-CAUSAL Collaboration, Ann Intern Med 2011
”Use of more stingentcriteria [e.g. GRADE], wouldlikelyreach the conclusionthatevidence insufficient to make firm recommendations [for starting ART at CD4 of 500 vsdeferring to 350 cells/µL].” None of the studies reliableassessednon-fatal potential harm.
The choice to make for asymptomatic treatment naïve patients Prognostic evaluation Prognostic evaluation Prognostic evaluation Start ART Start ART Start ART Talk in 2003
Major Guidelines for ART Initiation • (1) Strong strength recommendation based on observational data (A-II) • (2) Moderate strength recommendation based on expert opinion (B-III). • (3 ) But treat all HIV+ pregnant women, HBV co-infection, HCV co-infection, HIVAN, HIV related neurocognitive disorders, ITP, non-AIDS cancers and serodiscordant couples • (4) But treat individuals with CD4 < 350 a priority. • (5) But treat all HIV+ pregnant women ,TB co-infection with active disease and HBV co-infection with severe liver disease, and serodiscordantcopuls
Observational Analyses of Outcome From Deferred vs Immediate ART:Lack of Consistency
Transmission on ART – loworzero ?:largelyunknown for anal sex
Modest evidence to start ART when CD4 < 250/200 cells/µL http://www.biomedcentral.com/1741-7015/11/148
Unanticipated association between abacavir use and raised risk of myocardial infarction D:A:D Lancet 2008
ART exposure and AIDS- and non-AIDS-defining cancer AIDS-defining cancer (n = 1,151) Non-AIDS-defining cancer (n = 1,091) 1.1 1.1 aRR and 95% CI 1.0 1.0 aRR and 95% CI 0.8 0.8 Any cART PI NNRTI Any cART PI NNRTI ART exposure (/year) ART exposure (/year) Adjusted for age, sex, cohort, HIV mode of acquisition, ethnic group, calendaryear, body mass index, anyprior cancer, prior AIDS diagnosis, prior AIDS cancer, smoking status, HCV and HBV status D:A:D: Bruyand et al CROI 2013 Also Chao et al, AIDS 2012, Pikettyet al J ClinOncol 2012
Acknowledgements • RFH group: A Phillips, A Mocroft, C Sabin, F Nakagawa, F Lampe, L Shepherd, D Grint, A Schultze, et al • CHIP: O Kirk, L Peters, L Ryom, J Grarup, D Podlekareva, D Raben, M Mansfield, J Lazarus et al • WHO-EURO: M Donoghoe, I Eramova, B Drachmann, et al • J Rockstroh, G Faetkenheuer • EuroSIDA for EuroCoord colleagues last 20 years
What’s next? 6:30 p.m. Reception/Networking (Foyer)