Least Square Method in Engineering Experiments
Engineering experiments involve altering the independent variable to measure the dependent one, determining their relationship. The Least Square Method is used to find the linear correlation between variables by minimizing the sum of squared deviations. Applying this method helps find the constants in linear functions, leading to accurate representations of experimental data. This technique is essential in analyzing functional relationships and plotting data effectively.


Least Square Method in Engineering Experiments
E N D
Presentation Transcript
Engineering experiments involve the measuring of the dependent variable as the independent one has been altered, so as to determine the relationship between them. e.g. the relation between the applied load the deflection in a structural member.
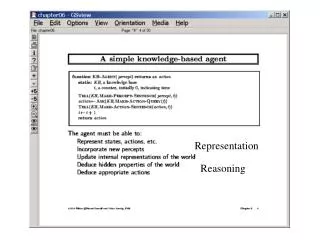
1 .LEAST SQUARE METHOD • In experimental work, readings are taken for a dependent variable as the independent variable is altered. It is usually required to plot the result and predict the relationship between the two variables. • If the relation between the two variable is linear, then they are correlated to each other by Eq.15.1 • Eq. 15.1 • y is the dependent variable, and is the independent variable • c, and m are constants, where c is the intercept, and m is the slope
The simplest approach to determine the c, and m constants is to plot the points and draw what appears to be a good straight line through the experimental points. The sum of the deviation of the experimental points from the fitted line must be as low as possible, Eq. 15.2. • Eq. 15.2
Where is the experimentally determined value, and is the corresponding value of the plotted line. • the best method for finding a good straight line representation of from experimental data is the least square method. Its principle is that the most probable straight line is located such that the sum of the square of the deviations is a minimum
According to this method the constants of the linear function could be determined by Eq. 15.3 • Eq. 15.3 • where No. of reading
2 . FUNCTIONAL RELATIONSHIP • This function may be treated as follows • Eq. 15.4 • Apply the least square method to determine the constants c, and m. The function may be plotted on normal plot as y versus 1/x.
3 . FUNCTIONAL RELATIONSHIP • This function may be treated as follows • Eq. 15.5 • Apply the least square method to determine the K , and m constants. • Determine the c constant • The relation may be plotted on log-log scale as a straight line.
Fig. 15.3. Graphical representation of logarithmic function.