Bland-Altman Plot of Normal Speed Changes: Ground vs. Treadmill Walking
10 likes | 135 Vues
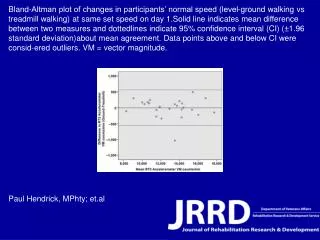
This study presents a Bland-Altman plot analyzing the differences in participants' normal walking speeds on level ground compared to treadmill walking at the same set speed on day one. The solid line in the plot indicates the mean difference between the two measures, while the dotted lines represent the 95% confidence intervals (±1.96 standard deviations) around the mean agreement. Data points above and below the confidence interval are identified as outliers, providing insights into variability in walking speeds. Authors: Paul Hendrick, MPhty, et al.

Bland-Altman Plot of Normal Speed Changes: Ground vs. Treadmill Walking
E N D
Presentation Transcript
Bland-Altman plot of changes in participants’ normal speed (level-ground walking vs treadmill walking) at same set speed on day 1.Solid line indicates mean difference between two measures and dottedlines indicate 95% confidence interval (CI) (±1.96 standard deviation)about mean agreement. Data points above and below CI were consid-ered outliers. VM = vector magnitude. Paul Hendrick, MPhty; et.al