Download

1 / 6
60 likes | 190 Vues
Join Ingo Rammer from Thinktecture for an insightful session on advanced debugging techniques in .NET 4.0. This session covers efficient debugging practices with breakpoints, multithreaded debugging support, exception handling, and IntelliTrace for easy problem isolation. Learn how to share debugging information with teammates, work with foreign assemblies, and leverage essential tools for optimal application performance. Stay updated with the latest trends and best practices in software architecture and development. Don't miss this chance to enhance your skills!

E N D
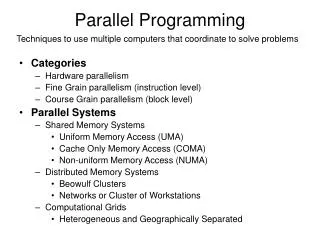
Parallel Programming in .NET 4.0 Tasks and Threading Ingo Rammer, thinktecture weblogs.thinktecture.com/ingo@ingorammer
Ingo Rammer and thinktecture • Support and consulting for software architects and developers • Architectural Consulting and Prototyping • Developer-Coaching and -Mentoring • Application Optimization, Troubleshooting, Debugging • Architecture and Code Reviews • Slides/Samples: http://weblogs.thinktecture.com/ingo • ingo.rammer@thinktecture.com
Please note: this session is a „classic“ with a change/addition rate of about 10-15% per year. Attendees who‘ve seen a previous version will therefore already know ~60-70%. (But you‘re of course more than welcome to join again! ;-)) • What else can I do with breakpoints? (Tracepoints, Groups, Conditionals, Macros) • How can I change the display for variables windows (from [DebuggerDisplay] to [DebuggerTypeProxy] and Debugger Visualizers) • How does VS support me with multithreaded debugging? • How can I debug foreign assemblies? (Breakpoints/Source stepping) • How should I work with Exceptions to simplify debugging? • How can I share information with another developer (breakpoint export, pinned variables)? • How can I isolate hard-to-reproduce problems during development? (Intellitrace) • How can I use Intellitrace during test? • How can I find problems which only happen at the user's computer? (Crash dump debugging) • Which other tools are essential?(DebugView, BareTail, Reflector Pro, LinqPad, Attach To Process-Macro ...)
Stay up to date with MSDN Belux • Register for our newsletters and stay up to date:http://www.msdn-newsletters.be • Technical updates • Event announcements and registration • Top downloads • Follow our bloghttp://blogs.msdn.com/belux • Join us on Facebookhttp://www.facebook.com/msdnbehttp://www.facebook.com/msdnbelux • LinkedIn: http://linkd.in/msdnbelux/ • Twitter: @msdnbelux DownloadMSDN/TechNet Desktop Gadgethttp://bit.ly/msdntngadget
TechDays 2011 On-Demand • Watchthis session on-demand via Channel9http://channel9.msdn.com/belux • Download to your favorite MP3 or video player • Get access to slides and recommended resources by the speakers