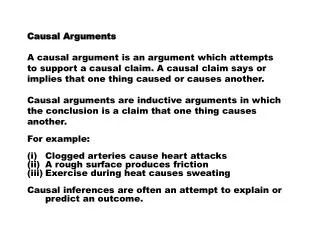
Understanding Inductive Generalization in Statistical Arguments
This text delves into the principles of inductive generalization, illustrating how specific sampling can be used to infer broader conclusions about a population. It emphasizes the importance of evaluating premises for truth, avoiding biases, and ensuring sample size sufficiency. By analyzing various examples, such as preferences in voting or health outcomes, it discusses the common fallacies that arise in inductive reasoning, such as hasty generalization and biased sampling. Ultimately, it serves as a guide to critically assess statistical conclusions drawn from sample data.

Understanding Inductive Generalization in Statistical Arguments
E N D
Presentation Transcript
Inductive Generalization – from the particular to the general = Sampling Arguments. Statistical Generalisations – some specific proportion of the members of the target class possess a certain property. 10% of people in this sample of the general population indicated they would vote for Bob. -------------------------------------------------------------------------------10% of the general population would vote for Bob.
Evaluating Inductive Generalisation 1. Are the premises true? hearsay or popular opinion and not fact? people lie to pollsters. 2. Is the sample large enough? 75% of observed coin tosses come up heads ----------------------------------------------------- 75% of all coin tosses will come up heads four coin tosses? 400 tosses? a.Fallacy of Hasty Generalisation b.Fallacy of anecdotal evidence.
Evaluating Inductive Generalisation 3. Is the sample biased in some other way? Fallacy of Biased Sampling. a. Insufficient variation in the sample 1. Using a phone book to get a large sample of the population. 2. Using birth-order as a behavioural predictor 3. Basing inferences concerning the general behaviour of native pigeons, say, on their behaviour when you've observed them.
Evaluating Inductive Generalisation b.Eliciting a particular characteristic from the sample by Slanted Questions 1. Washington Post-ABC News Poll April 2005 36. Would you support or oppose changing Senate rules to make it easier for the Republicans to confirm Bush’s judicial nominees? Support Oppose No Opin. 26 66 8 2
Evaluating Inductive Generalisation 4. Is the inference justified? i. The sample size ii. The level of confidence iii. The margin of error
Inductive Particularisations - from statistical generalities to facts or claims about particulars Arguments from Statistical Premisses, or Statistical Applications. All ravens we have seen have been black -------------------------------------------------- The next raven we will see will be black 72% of all Australians are content with their lives Robert is an Australian ------------------------------------------------------------ Robert is content with his life Most Australians are happy Bob is an Australian ---------------------------------- Bob is happy
Evaluating Inductive Particularisations 1. Are the premises true? 2. How Strong is the Conclusion? 3. Is the Reference Class the Appropriate One? 98% of people who have their gall bladder removed recover easily Martha is going to have her gall bladder removed ----------------------------------------------------------------------------- Martha will recover easily 98% of 90 year old people who have surgery do not recover easily Martha is a 90 year old person about to have surgery ----------------------------------------------------------------------------- Martha will not recover easily The reference class must meet the requirement of total available relevant evidence.
Note on Terms Consider the following five quantities: 180, 40, 25, 15, 15. i. The mean is the arithmetic average. To find it add the numbers together and divide by 5. Result: 55. ii. The median is the number in the middle of the range (1/2 of the numbers are bigger than it and ½ are smaller). Result: 25. iii. The mode is the number that is most common. Result: 15.
Numerical illiteracy = innumeracy – leads to acceptance of claims based on bad maths Example – AIDS Testing (HYP) Assume that there is a test for AIDS that is 98% accurate. I.e. if x has AIDS then x will test positive 98% of the time and if x doesn't have AIDS x will test negative 98% of the time. Assume also that 0.5% of the population of Australia has the virus — i.e., one person in every two hundred, on average. Assume 10,000 tests are carried out. Number of people in (average) sample having AIDS = 0.5% of 10,000 = 50. Of these, 98% will test positive (by HYP) ------------------------------------------------------------------------------------ Number of people having AIDS & testing positive = 98% of 50 = 49. Number of people in (average) sample not having AIDS = 99.5% of 10,000 = 9,950. Of these, 2% will test positive (by HYP — since 98% will test negative) ------------------------------------------------------------------------------------ Number of people not having AIDS & testing positive = 2% of 9,950 = 199. 248 people in every (average) population sample of 10,000 will test positive yet only 49 of these have the disease. Less than 1/5th of all those testing positive have good reason to worry! if you have AIDS then there's a 98% chance of you testing positive – TRUE if you test positive then there's a 98% chance that you have AIDS – FALSE if you test positive then there's less than a 20% chance of you having the disease – TRUE
numerical illiteracy Example – Psychic Phenomena Psychic Phenomena Extra-sensory perception Psychokinesis Telepathy Clairvoyance
numerical illiteracy a.Predictive Dreams and Precognition Chance/night of predictive dream = 1/10,000. Chance/night of not predictive dream = 1 - 1/10,000 = 9,999/10,000 Chance of two successive nights of non-predictive dreams is: 9,999/10,000 x 9,999/10,000 Chance of only non-predictive dreams all year is: (9,999/10,000)365 = 0.964. So 3.6% do have a predictive dream by chance on some night of the year.
For 18 million people we should expect about 650,000 predictive dreams each year. The following is thus bad numerical reasoning: (1) The probability of a predictive dream occurring by chance is so low that the number of actual instances cannot plausibly be put down to coincidence. So, (2) Precognition is a more plausible explanation. Yet, (3) Either predictive dreams happen by chance or precognition occurs. So, (4) The most plausible explanation of predictive dreams is that precognition occurs.
Numerical illiteracy b.Telepathy on Demand (1) The probability of cold reading occurring by chance is so low that the number of actual instances cannot plausibly be put down to coincidence. So, (2) Telepathy is a more plausible explanation. Yet, (3) Either cold reading happens by chance or telepathy occurs So, (4) The most plausible explanation of cold reading is that telepathy occurs.
Numerical illiteracy c. General Schematic Argument (1) The probability of an X occurring by chance is so low that the number of instances cannot plausibly be put down to coincidence. So, (2) Y is a more plausible explanation. Yet, (3) Either X happens by chance or Y. So, (4) The most plausible explanation of X is that Y.
Numerical illiteracy Example – Gambler’s Fallacy The fallacy of thinking that since, say, a fair coin has come up heads eight times in a row it is more likely to come up tails next throw.