Download
1 / 19
190 likes | 296 Vues
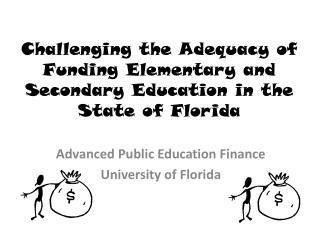
Washington State ranks low in per pupil funding and class size, significantly impacting student outcomes. The "Paramount Duty" stipulates that the state must provide ample education for all children, yet funding formulas from the 1970s still dominate. Amidst a declining share of K-12 funding, students with greater needs face further challenges. Learn how local levies, state funding, and advocacy can shape future education reforms. Join us in contacting legislators and pushing for necessary changes to achieve a fair and adequate education system for all.

E N D
Education Funding & Current Budgets And what you can do about it! Washington State PTA
How do we compare? • State – 42nd in per pupil funding • State – 45th in class size • Region 2 School Districts – Snoqualmie Valley 282nd Issaquah 268 Lake Washington 264 Riverview 217 Mercer Island 168 Bellevue 151 Source: OSPI
The “Paramount Duty” • “It is the paramount duty of the state to make ample provision for the education of all children…” • “The Legislature shall provide for a general and uniform system of schools…” • Washington State Constitution, 1889
Education Reform • The 1993 Education Reform Act launched high standards of achievement for Washington students, teachers, and schools • We are still waiting for a education finance system that is “ample, flexible, stable, equitable, straightforward and accountable”
MORE STUDENTS WITH GREATER NEEDSSpecial Ed Poverty Bilingual Source: OSPI
State Funding Formula • The state funds are based on a formula, computed in the 70’s • Did not consider security or technology • Lower Community expectations for AP/IB classes, nurses, counselors, librarians, PE teachers, music teachers etc.
Washington’s Leaky Pipeline Out of 100 9th grade students 71 graduate from HS 42 immediately enter college 26 come back for a 2nd year 18 graduate with AA 3 years or BA in 6 years Source: National Collaborative for Postsecondary Education Policy. 2003. “Report to the Washington Advisory Group,” September 29.
How is a School District Funded? Enrollment Staff Units (I.E Teachers, Administrators & Aides) Salaries & Benefits Nonemployee Related Costs (NERC) State General Apportionment Allocation
Sources of School Funding(Statewide Average) 10%: Federal Funding 4%: Other Sources 16%: Local Levies 69%: State Funding Source: Organizing and Financing of WA public Schools 2006
Federal Funding • Special Education • Children in Poverty • Food services
Teacher Salaries • 75- 89% of school budgets go for salaries and benefits • Washington has a statewide “salary schedule,” but final salary decisions are negotiated locally – “tri- days” • Roughly 50% of teachers are on the state salary schedule
Base Staff Salaries ’05-’06 Teacher Admin Class Lowest 30,383 45,000 23,025 Highest 32,310 75,000 32,885 Put local district here
Local Levies • Local levies are property taxes paid by citizens within a school district • M&0 (misnamed maintenance and operations) • Technology • Capital • To pass, local levies must receive a 60% “yes vote,” also called a “supermajority”
“Lids” on local levies • School districts have “caps” or “lids” on how much they can tax • Riverview 24.45% • Snoqualmie Valley 24.67% • Lake Washington 24.89% • Issaquah 24.97% • Bellevue 30.26% • Mercer Island 33.45%
What can you do? • Contact local Legislators • Sign up for action alerts, email legislators • Follow Washington Learns • Follow the Special Ed Lawsuit • Follow the NEWS lawsuit
We HAVE been successful • Legislators count the emails • They really pay attention to personal emails • They contact many of us to take the “pulse”
What has our efforts accomplished? • Locally – Put any local wins here (with school district) • I-728 and I-732 • Special Ed lawsuit • Rollback Bill • Ed Funding Study – Washington Learns
Seeking State Solutions • Share this information with your community • Email legislators – it DOES work!