Soil Vapor Extraction
Soil Vapor Extraction. Contamination in the Vadose Zone. The vadose (unsaturated) zone acts as a “buffer zone” for protecting the quality of the underlying ground water. When contaminated, however, it acts as a source zone for ground water pollutants and gaseous emissions.

Soil Vapor Extraction
E N D
Presentation Transcript
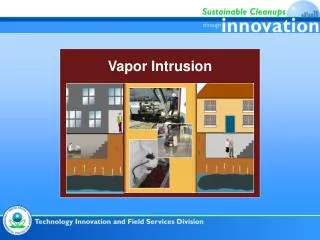
Contamination in the Vadose Zone • The vadose (unsaturated) zone acts as a “buffer zone” for protecting the quality of the underlying ground water. • When contaminated, however, it acts as a source zone for ground water pollutants and gaseous emissions.
Soil Vapor Extraction (SVE) • Targets the removals of VOCs from the vadose zone by volatilization • Shown to be effective at removing NAPL, aqueous, and sorbed phases • Encourages aerobic biodegradation • Proven technology with some design guidance (rule-of-thumb).
Case Study: JP-4 Spill at Hill AFB, Utah • A JP-4 fuel spill site at Hill, AFB , Utah was selected to be modeled using VENT3D. • This is probably the most comprehensive data set collected from a field application of SVE. • Several pilot studies, and a full scale soil vapor extraction (SVE) operation under a variety of flow conditions were conducted at the site. • Data for gas concentrations, contaminant concentrations, mass removals and vacuum pre- and during-operation were provided by the researchers.
VENT3D Description • VENT3D solves the 3-D vapor phase advection-dispersion equation for a mixture of compounds. It computes the 4-phase distribution for each compound between vapor moving periods, assuming equilibrium partitioning between phases. • The model domain is discretized into blocks.
VENT3D Flow Algorithm • The model solves the 3-D steady-state gas flow equation using finite-difference. • where k= soil vapor permeability tensor (L2), P= soil-gas pressure (M/LT2), = soil-gas viscosity (M/LT),W= vapor mass flux source/sink (M/T), R= universal gas constant (ML2/T2 mole oK), T= temperature (oK), MW= molecular weight of soil-gas (M/mole), k*= intrinsic permeability (L2), • = air filled porosity (dimensionless), v= interblock gas flow (L/T).
VENT3D Transport Algorithm • Knowing the 3-dimensional interblock flows, the 3-D advection-dispersion equation is solved by finite-difference for each chemical compound. • where Mn = total molar concentration of compound n in mixture (mole/L3), Cn =molar concentration of compound n (mole/L3), q = vapor discharge vector (L/T), Fn=volumetric molar loss/addition rate of compound n (mole/L3T), Dn= the dispersion tensor (L2/T) , Dm= molecular diffusion coefficient (L2/T), Do= free air diffusion coefficient (L2/T), I = identity vector, = vapor dispersivity values (L), qx,qy= vapor flow in x,y,z, direction (L/T), = magnitude of the discharge vector (L/T).
Phase Partitioning • Equilibrium partitioning is assumed between the different phases for each compound. Equilibrium is re-calculated at the end of each time step. The total molar concentration of each compound is expressed as a function of the vapor concentration and the sum of the molar concentrations in the 4 phases: • where MHC=molar concentration of NAPL phase in soil (mole/L3), Pv= compound vapor pressure (atm), MH2O= molar concentration of dissolved phase (mole/L3),n=activity coefficient of compound in water (dimensionless), Kdn= distribution coefficient of compound (dimensionless), = soil density (M/L3), MWH2O= molecular weight of water (18 gm/mole), H2O= soil moisture flag=1 if present, 0 if not present.
Site History • 27,000 gallons (76,500 kg) of JP-4 jet fuel spilled in January 1985. • Contaminated area west of spill area = 160 ft * 120 ft *50 ft. • A field study of soil venting was performed at the site in 1988-1989.
VENT3D Vertical Layers • The contaminated soil volume is divided into 11 layers, each having different initial contaminant concentrations in soil.
VENT3D Horizontal Grid • Each layer is divided into a 16 * 12 orthogonal grid, each grid cell is 10 ft wide *10 ft. long. The grid shows the subareas to which the vertical vent area was divided. Each subarea is presented by a soil boring V1, V2........V15.
JP-4 Composition • Reported and estimated standard weight fractions for JP-4 components.
Determining Site Permeability • The horizontal and vertical permeabilities at the site were estimated using GASSOLVE, a computer program developed by Falta (1996). • GASSOLVE uses analytical solutions to the steady-state gas flow equation for different boundary and initial conditions. • The permeability is found by fitting the analytical solution to pressure data collected from air permeability tests. • GASSOLVE adjusts the permeability until it reaches a minimum residual sum of squares between the calculated and observed pressures.
GASSOLVE Results • Pressure data from four pilot tests were used by GASSOLVE to determine the air permeability of the formation. • Results indicated: • horizontal permeability = 40 darcys. • vertical permeability = 1 darcy.
Flow Calibration &Validation • Five pilot tests were simulated by VENT3D using GASSOLVE estimated permeabilities. • Three of the full-scale operation flow tests were simulated by VENT3D.
Vacuum Adjustment • VENT3D calculated pressure was adjusted at extraction wells using the equation adapted from Anderson and Woessner, 1992. • where Pw is the well pressure, P i,j is the calculated pressure, Qw is the pumping/injection rate, k is the permeability, is the fluid viscosity, is the fluid density, g is the gravitational acceleration, re is the effective well block radius and rw is the well radius.
Transport Calibration • The total initial contaminant mass was adjusted until the measured mass removals from the pilot tests and calculated mass removals from VENT3D matched within less than 20% error. • The initial total mass was estimated to be as high as 76,000 kg based on the spill volume. • Five pilot tests were simulated and mass removals were compared.
Transport Calibration Using Pilot Tests • Data from pilot tests were not successful in the calibration step due to some discrepancy in reported data.
Transport Calibration Using Full Scale Operation • Mass removals recorded at the beginning of the full-scale operation were used to verify the calibration process.
Transport Validation • Mass removals from simulations representing the whole operation were compared with the measured values.
Average Extraction Rates • To evaluate whether the detail of the flow history was necessary,the • 25 flow tests conducted during the full-scale study were represented • by one simulation.
Average Extraction Rates • VENT3D estimated a 2% difference in removals.
Predicting System Behavior • VENT3D was used to predict the extent of contamination if SVE was not carried out at the site.
Conclusions • The design and performance of remediation systems can be greatly improved through the use of mathematical models. • VENT3D proved successful in representing site characteristics with respect to subsurface air flow and for simulating the performance of a vapor extraction study conducted at a JP-4 jet fuel spill site at Hill AFB. • Air permeability was appropriately estimated using GASSOLVE. • VENT3D helped in determining the initial total contaminant mass at the site.
Conclusions (cont.) • 3-D modeling provided a closer match to field measurements than 2-D modeling. • The loss of accuracy in 2-D modeling was small from a design standpoint and was accompanied by considerable savings in computer time. • JP-4 could be represented with a mass-equivalent 10-compound mixture, and even a single component representing the mixture. • The gain in accuracy provided from modeling the multi-component mixture also came at the cost of extra computational effort.
Conclusions (cont.) • The slight improvement in accuracy by using 3-D modeling and detailed multi-component representation of the jet fuel does not justify the increased computational effort. • We therefore propose that for similar applications, one can represent the mixture by a smaller number of compounds and use a two-dimensional model without considerable loss of accuracy. • VENT3D was useful in demonstrating the changes in JP-4 composition during SVE .
Conclusions (cont.) • In this case, a surface seal was predicted to have minimal effect on cumulative mass removals. • If a model was to be used for design purposes, it would be more convenient to be able to use average (constant) flow conditions instead of going through a lengthy, complicated process of running a large number of simulations. • Data from long-term studies give a better description of site conditions and system behavior than data from pilot tests.
Limitations • VENT3D calculated soil gas concentrations did not match well with observed concentrations due to the following: • mass distribution from soil cores was not accurate. • VENT3D does not allow for specifying different mass fractions at different locations. • VENT3D does not account for mass transfer limitations. • The site domain was modeled as a homogeneous formation.