Business Intelligence (BI) Software
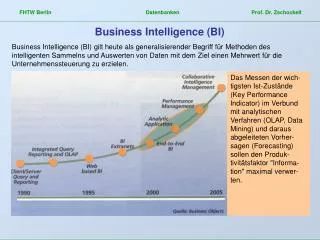
Business Intelligence (BI) Software. What is Business Intelligence? BI is composed of many applications, technologies and methods used for gathering and analyzing data. This helps in decision making and planning.

Business Intelligence (BI) Software
E N D
Presentation Transcript
What is Business Intelligence? • BI is composed of many applications, technologies and methods used for gathering and analyzing data. • This helps in decision making and planning. • BI applications include query and reporting, data analysis, data mining, and forecasting. • The end result of BI is leveraging business assets to improve business performance
What is the REAL difference between AutoCube and my Autologue, AIS, Datatron, or SBC management system?
Management system = OLTP ( OnLine Transaction Processing )Processes the sales and inventory transactions for a company
AutoCube = OLAP ( OnLine Analytical Processing)Analyzes and reports, using data extracted from the management system
How does AutoCube work ? The AutoCube data warehouse is stored on an SQL server that is separate from the Management System server. It is updated nightly with a specially selected set of the day’s data from the Management System. After the data is loaded into the AutoCube SQL data warehouse, the individual cubes are reprocessed ( refreshed ) to bring the cube data up-to-date.
Exactly what is a CUBE ? Quick answer: A multi-dimensional spreadsheet In a Cube spreadsheet, multiple Dimensions ( Time, plus one or more other Dimensions such as Store or Product ) are used to determine the values of Measure fields like Sales Price or Cost.
Typical cube reports can have as many as 6 Dimensions:TimeStoreProductCustomerCounterperson / SalesmanTransaction Type
The theoretical number of data points in a cube is STAGGERING.Let’s say that a customer has these Dimension sizes:5 Stores20 Countermen1000 Customers250000 Part Numbers6 Transaction Types For one year’s ( 365 days ) data for just the Sales Price measure:
Microsoft SQL uses a complex set of algorithms to pre-calculate all of the most likely and most important data points, based upon the design of the cube, such as totals by Store, Customer, Product Line, etc. These calculated totals are stored in their own separate, special database, apart from the SQL data warehouse. This design enables the rapid response time for higher-level queries. When you drill-down to a lower level in the cube that is not pre-calculated, the cube must then query the SQL data warehouse and calculate the data totals on the fly.
Why we use Microsoft’s BI Solution • Significantly lower entry cost, compared to other vendors like IBM, SAP, Oracle, MicroStrategy, or SAS • Runs on inexpensive PC server hardware • Uses integrated Microsoft security for user access to the data
Microsoft Excel is the tool used to access the cube data • The full features of Excel, such as charting or conditional formatting, are available for use with the cube data • With many users already having some level of Excel proficiency, getting up to speed on the BI features of Excel normally takes much less time as compared to competing products.
AutoCube helps customers in the Automotive Aftermarket increase sales and reduce costs How does it do this?
Sales AnalysisStore or Geographic Analysis – What is being sold by store or geographic region such as state, city, or individual zip code? How do stores compare with each other in terms of profit margins for the same product lines and sublines?Salesperson Profitability – What products are your sales people selling to what customers? How do they stack up against other sales people in terms of volume and profitability?Customer Profitability - Who are your profitable or unprofitable customers? Which customers have widely different profit margins within the same product line or subline?Product Profitability – What are your profitable or unprofitable product lines or sublines? How do similar product lines or sublines compare with each other in terms of volume and profitability?Time Analysis – What times of day or days of the week have the highest or lowest volumes for your stores? How does the productivity of individual sales people vary by time of day? Do particular customers only buy at certain times of the day?
Customer AnalysisCustomer Segmentation - What distinct types or groups of customers do you have? How do the customers within these groups compare with one another in terms of volume and profitability? Buying Habits – Are certain customers “cherry-picking” only select low-profit items, and not buying items from any of your most popular or profitable lines? Or, why is a large-volume customer not buying any items of a certain product line or subline that you know they must certainly need?Relationship Analysis - Are customers exhibiting patterns that indicate that they are probably buying more and more frequently from your competitors? Does a customer have an unusually high level of defect returns or new product returns in a particular product line or subline?
Product ManagementInventory Analysis - What items are we over-stocked on? What items are slow moving? What items are consistently our biggest sellers? What items have a high defect rate or return rate?Inventory Management - What items should we be stocking in our satellite warehouses or retail stores? What overstocked items should be returned from a store to your warehouse or possibly to the manufacturer? What items are always being transferred between stores or between your warehouses and stores? Demand Forecasting – What should a product’s safety stock level or reorder point be set at, based upon historical demand for that product and what your definition of “demand” is?
Increased ProductivityTime Savings - Complex reports can often be built in a fraction of the time it takes as compared to building them off of the management system. Users must often run several management system reports, load them into separate Excel spreadsheet tabs, then write formulas to combine the data from all the tabs. AutoCube provides all of the data in one place, eliminating the need to combine data.Ease of Use – Users don’t need to be Excel experts, or even have to know how to build formulas in Excel. AutoCube has built-in most of the common business calculations like profit margin and profit margin percentage, as well as providing a wide range of comparison data such as month-to-date vs. same month-to-date last year, year-to-date vs. last year-to-date, etc.Reduced load on IT department - AutoCube enables end-users to “self-serve” data, eliminating the need to involve the IT department in building most custom reports. And, with the Autologue cloud solution, the customer’s IT department doesn’t need to worry about managing the SQL server and controlling user access.