Air Pollution
Air Pollution. Introduction. Currently only two real problematic classes of pollutants Non-point source agricultural pollution Air quality Difficult to control because air flows in all directions (air shed) Difficult to perform bioassay
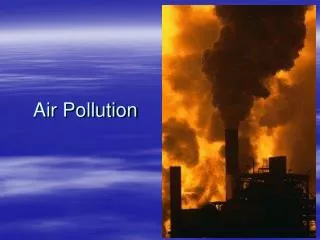

Air Pollution
E N D
Presentation Transcript
Introduction • Currently only two real problematic classes of pollutants • Non-point source agricultural pollution • Air quality • Difficult to control because air flows in all directions (air shed) • Difficult to perform bioassay • Easier to control front end (decrease generation of polluted air) than back end (clean up polluted air) • Like water pollution, originates in one place, impact another place (unlike soil pollution). • Most air pollution due to use of E.
Major Sources of Air Pollution Residential fuel combustion, farming operations, construction, road dust, wind-blown dust, Sources of all air pollutantsmeasured in California* (Hydrocarbons, Carbon Monoxide, Oxides of Nitrogen, Oxides of Sulfur and Particulate Matter) Source: California Department of Consumer Affairs, Bureau of Automotive Repair
Regulations – Clean Air Act • Based on impact over a large area but low impact over any one area • Goal – maintain air quality to protect human health and welfare (= environment) 1. Two stage protection scheme a. Human health at work b. Widespread environmental controls 2. Two primary sources of air pollution (complex problem) a. smoke stacks (power plants, manufacturing) b. mobile sources (auto’s California acid rain) note: NE corridor/Los Angeles = 70% of problem
Regulations – Clean Air Act (con’t) B. Policy – maintain “safe” outdoor concentrations of pollutants hazard = exposure X effect / \ \ conc. x duration LC50, etc C. Strategies 1. Regional air quality plan – if pollution levels go up deny new stack permits and/or alter flow of transportation 2. Emission control standards - reduce air pollution using Best Available Control Technology (BACT)
Regulations – Clean Air Act (con’t) • BACT • Front end control • Compromise between function and cost effectiveness - zero emissions possible but too expensive • BACT for auto’s (mobile source control) - emission control devices (eg catalytic converter) ~ $700 each because platinum (most expensive precious metal) - mileage standards (fleet mileage goals never reached) Note: gas was cheap so no incentive (abandoned by Reagan, Bush Sr, most recently Bush Jr wants us to “conserve”). Now gas is not cheap, and US is major contributor to global CO2 increase • BACT for stationary sources (smokestacks, dry cleaning) - sulfur scrubbers expensive so try to use low sulfur coal (S is high in eastern coal, low in western coal
Examples of reduction in air pollution after passage of Clean Air Act
Some air pollution is not regulated Wishful thinking
More unregulated air pollution - burning rice stubble in Poinsett Co., Arkansas Photo by R. Grippo
Air pollution in India Photo by R. Grippo
Policeman directing traffic in India Photo by J. Farris
Major Air Pollutants- mostly coal-plant generated • Suspended particulates - Most common, oldest problem addressed 1. Trace rock from burning pulverized coal (unburnable residues) 2. Fly ash from coal (contains Cd, Cu, Pb, Se, As, Hg) has high volume control by electrostatic precipitators • Carbon/soot from diesel • Gasses • SO2 - respiratory inhibitor - plant leaf injury - decreases N fixation in bacteria - oxidizes to SO3 (sulfur trioxide) H2SO4
B. Gasses (con’t) 2. Oxidants (O3 ) - in atmosphere not enough - at ground level too much comes from hydrocarbons (gasoline) + O2 = O3 - also a respiratory aggravator - leaches nutrients from soil lower primary productivity less carbon fixed increase greenhouse effect 3. Nitrogen oxides (NOx) - N2O nitric acid – comes from atm N (atm = 80% nitrogen) - NO2 nitrous oxide (ha, ha!) - respiratory aggravator - decreases soil pH reduces soil micronutrient availability to plants - NO2 + H2O = HNO3 = brown haze = smog Photo courtesy U.S. EPA
B. Gasses (con’t) 4. Carbon oxides - CO monox competes with O2 binding on hemoglobin (affinity is 200X O2 ) - CO2 dioxide = greenhouse effect
Minor Gaseous Air Pollutants Low in direct effects, high in indirect effects • CFC’s (Freon) • Principal refrigerant (a/c, refrigerators) • Catalyze destruction of ozone • Ozone forms protective layer around earth partially blocks UV • Montreal Accord (1990) – supposed to phase out CFC’s by 2000 (not completely done yet) • Halon • Related to CFC • Used in fire extinguishers • Carbon tetrachloride and Methychloroform • Dry cleaner solvents • Manufacturing processes All above compounds catalyze the destruction of ozone Recall: catalyzers participate in a reaction but are not consumed hang around a long time (1/2 life of several years) and continue to reduce ozone • Therefore, if stopped using now good effects would take many years to appear
Ozone Depletion Capacity of Commonly Used Chemicals Chemical Atmospheric Share of Contribution Lifetime (yrs) to Depletion (%) CFC-11 76 26 CFC-12 139 45 CFC-113 92 12 Halon 1211 12 1 Halon 1301 101 4 Carbon tetrachloride 67 8 _________________________________________
Characteristics of Greenhouse Gasses 346 1.65 0.31 0.02 0.0002 0.00032 1 32 150 2000 14,000 17,000 _______________________________________________ CO2 CH4 N2O O3 CFC-11 CFC-12 Atm contribution Potential GH effect Note: Up to 1970 CO2 dominated by 1980 dominance decreased by 2020 other gasses dominate. Result in predicted increase of 0.5º to 3º C
Indoor Air Pollutants • Includes SO2, NOx, CO, CO2 (coal furnace, kerosene heater especially if burn out • Formaldehyde • Common constituent of building material • Many health effects (humans very sensitive • Respiratory aggravator • Potential carcinogen • “sick building syndrome” – formaldehyde volatilizes from building mat’l (including adhesives) trapped inside because buildings are airtight to increase E. efficiency people get sick
Non-industrial, non-regulated sources of in-door air pollution Source: AirAdvice, Inc.
Summary of Major Air Pollutants • Burning fossil fuels = air pollution • Coal sulfur acid rain • Cars NOx - “ “ , haze Approximately 10,000,000 premature deaths/year world-wide are attributable to stationary and mobile air pollution sources
The least lethal form of energy production Sharon Harris nuclear power plant, NC Photo by R. Grippo