Activity-Based Multimodal Corridor Simulation: Light Rail Analysis
320 likes | 413 Vues
Explore a study on a light rail corridor using activity-based microsimulation framework, focusing on TRANSIMS model deployment in Greater Phoenix. Project objectives include performance evaluation of mixed mode network, rail crossings, and future light rail extensions. Analyze synthetic activity data, ongoing work, and preliminary results. Phoenix Metropolitan Area features a growing population and vital city stops served by the light rail transit system. Learn about network development, activity locations, O-D Trip Tables, rail bias, and results from the microsimulation model. Discover insights into congestion, traveler routing, and trip durations for improved transportation planning.

Activity-Based Multimodal Corridor Simulation: Light Rail Analysis
E N D
Presentation Transcript
Analysis of a Multimodal Light Rail Corridor using an Activity-Based Microsimulation Framework S. Ellie Volosin & Ram M. Pendyala, Arizona State University, Tempe, AZ Brian Grady & Bhargava Sana, Resource Systems Group, Inc. Brian Gardner, Federal Highway Administration, Washington DC May 8 – 12, 2011; Reno, Nevada 13th TRB National Transportation Planning Applications Conference
Outline • Background • Project overview and objectives • Geographical area and regional network • Preparing the network • Trip-based demand • Execution of TRANSIMS • Trip-based results • Light rail line extensions • Synthetic activity file generation • Activity-based analysis - preliminary results • Ongoing work and Conclusions
Background • Need for planning tools that offer greater level of detail • Disaggregate models better able to replicate human behavior more closely • Microsimulation models track each traveler individually • Limited work on microsimulationoftransit modes
Project Overview • TRANSIMS deployment case study in Greater Phoenix Metropolitan Region • Funded by Federal Highway Administration • Emphasis on two developments • Microsimulation of transit modes • Activity demand generation module • Application to a mixed mode corridor including auto, bus, and rail modes
Project Objectives • Implement, calibrate, and validate TRANSIMS model • Evaluate performance of mixed mode network • Intersection delay • Rail crossings • Transit transfers and boardings • Use calibrated model to predict conditions with future light rail extensions
About the Greater Phoenix Region • 4.28 million people in the metropolitan area • City of Phoenix is the 5th largest in the U.S. • Eight separate cities in the region with more than 100,000 people each
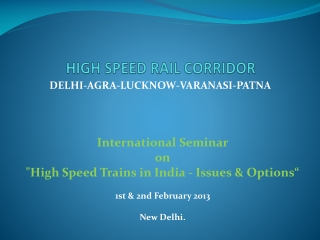
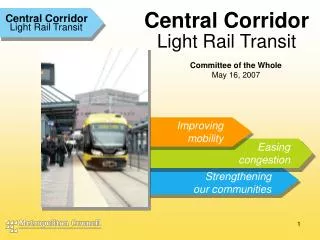
Light Rail System • Light Rail Transit (LRT) line began service in Dec, 2008 • Starter line ~ 20 miles long • Serves West Mesa, North Tempe, and Central Phoenix • Important service stops • Arizona State University • Mill Avenue Shopping District • Professional Sports Facilities • Phoenix Sky Harbor Airport • Phoenix Central Business District
Network Development • Network adapted from 4-step model network • Centroid connectors deleted • All speeds and capacities set to physical values • External connectors retained • TRANSIMS built-in network conversion tool
Network Development • Transit network created from route stops and route characteristics • Route headways vary by service times • Routes coded with stops and “pass-by” points • Manual adjustments made to lane connectivity
Definition of Activity Locations • Activity locations (ALs) constitute the start and end point of every trip • Alternative to the zone centroid in the 4-step model • All activity locations are assigned a corresponding zone • Each zone must have at least 1 AL assigned to it • Developed a program to • Identify zones with no ALs • Locate the closest AL to that zone centroid • Reassign the AL found to the zone in question
O-D Trip Tables • Initial implementation was O-D trip table-based • Obtained from the 4-step model • Trip tables by mode: SOV, HOV, bus, express bus, light rail • Trips by purpose (6 purposes) • Time of day applied through diurnal distributions • Calculated from NHTS 2009 data • Distributions by mode and purpose • TRANSIMS trip conversion tool • ~15 million trips in Greater Phoenix Metro Area
Rail Bias • Found light rail boardingsbelow observed ridership numbers • Two possible transit options in TRANSIMS • “transit” or “transit with rail bias” • Found that coding all transit trips as “transit with rail bias” improved boarding counts • Rail bias is set higher than 1 • Prompts transit riders to prefer rail over bus
Execution of TRANSIMS • TRANSIMS Studio: GUI built to aid in TRANSIMS model building • TransVIS: visualization tool built for TRANSIMS • Currently running TRANSIMS Studio • 64 bit Windows machine • 6 processors = 6 traveler partitions • 1 full microsimulation takes about 2 days • Adding more processors could reduce run times
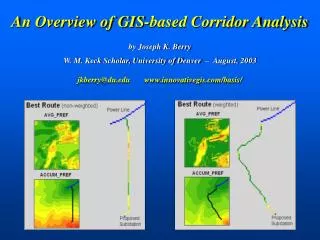
Router Stabilization • Iterative method • In each iteration, re-route only select travelers • Plan Sum finds travel times based on free-flow speed
Microsimulator • Process similar to that of Router stabilization • Microsimulator is used rather than Plan Sum • Microsimulator considers congestion along continuous time axis • Cellular automata model • Every travel lane is a series of cells • Only one vehicle can exist in a cell at a time • Microsimulator includes parameters for following distance, reaction time, look-ahead distance, etc.
Results based on O-D Tables • Total travel time for all trips = 5824751 hours • Average travel time = 30.08 minutes • Maximum vehicles on the network = 652159 at 3:49:51 pm • Time schedule problems still experienced • Departure time • Arrival time • Wait time
Light Rail Scenario • Selected two planned extensions • Northern extension • Mesa extension • All transit trips in the O-D tables still coded as “transit with rail bias” • Even with fixed demand, transit riders have a choice
Light Rail Scenario Results • Found expected increase in rail boardings • Also found increase in bus boardings • Could be due to a greater number of travelers taking advantage of transfer opportunities
Generating Synthetic Population • PopGen software used • Developed at ASU • Chosen for its flexibility • No learning curve for ASU researchers • Synthesis performed to generate2009 population • Synthetic Population Summary • Number of Household File Records = 1521189 • Average Persons per Household = 2.76 • Average Workers per Household = 1.32 • Average Vehicles per Household = 1.81
Synthetic Activity Generation • Used TRANSIMS built-in activity generator: ActGen • Inputs: • Synthetic population with household descriptions • Survey file with activities pursued by persons in varying household types • Output: • File containing daily activity schedules for every person in the population • Used synthetic population from PopGen • Input survey file created from NHTS 2009
Preparation of Input Survey Data • Trials made with different survey samples • Only Arizona survey records • 4511 survey records • 2.99 activities per person generated • 8.37 activities per household generated • All U.S. survey records • 136136 survey records • 4.52 activities per person generated • 12.83 activities per household generated • Used entire US survey records for richer sample from which to draw activity records
Preliminary Activity Generation Model • Activity-based travel simulation in the early stages at this time • All activities simulated for morning peak period • 6:00 to 9:00 AM • Model not yet validated
Ongoing Work • Initial results from activity generation simulation show an under-estimation of trips and transit boardings • Exploring possible ways to enhance replication of base year traffic volumes and boardings • Focus on ActGen module • Will apply the activity-based model to analyze two proposed light rail extensions
Questions http://simtravel.wikispaces.asu.edu
Results based Activity Files • Total travel time for all trips = 406944 hours • Average travel time = 50.53 minutes • Maximum vehicles on the network = 55774 at 8:45:31 am • Most common problems • Departure time • Transit Capacity