Download
1 / 6
60 likes | 73 Vues
This article discusses the impact of Hurricane Isabel, including damages, power outages, and increased turbidity of offshore waters. It also highlights observations from the Fourth Convection and Moisture Experiment (CAMEX-4) and the 30-year satellite record of Arctic and Antarctic sea ice extents.

E N D
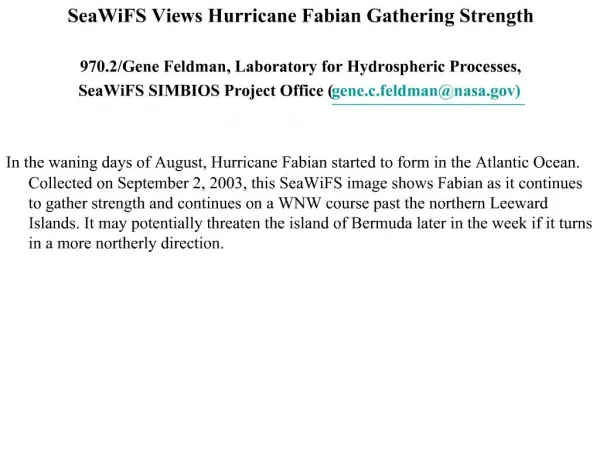
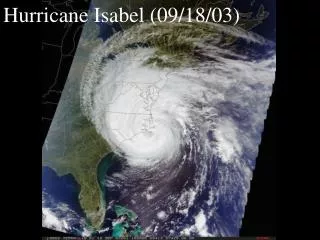
SeaWiFS Views the Wrath of Hurricane Isabel 970.2/Gene Feldman, Laboratory for Hydrospheric Processes, Office for Global Carbon Studies (gene.c.feldman@nasa.gov) On Sunday, September 14th, Hurricane Isabel started becoming a potential problem in the Atlantic Ocean and continued to gain strength throughout the next few days as it drew closer to the US East Coast. Collected on Thursday, September 18, 2003, this SeaWiFS image shows Isabel as it made landfall near Cape Lookout, North Carolina. Isabel caused millions of dollars in damages, power outages that lasted over a week, water restrictions, and loss of life. The day after the hurricane came ashore, a marked increase in the turbidity of the offshore waters was apparent. As the storm passed, the waves it generated stirred up bottom sediments, and the rain that fell washed more sediment off of the land. The Gulf Stream then drew some of this turbid water into a long, narrow plume as it flowed past the North Carolina coast toward the open sea.
SeaWiFS Views the Wrath of Hurricane Isabel September 18, 2003
Hurricane Erin Data From CAMEX-4 975/Gail Skofronick-Jackson, Earth Sciences Directorate, Laboratory for Hydrospheric Processes, Microwave Sensors Branch (gail.s.jackson@nasa.gov) • Observations from the Fourth Convection and Moisture Experiment (CAMEX-4): ER-2 Doppler (EDOP) reflectivities co-located with brightness temperatures from the High Altitude MIMC Sounding Radiometer (HAMSR) and the Advanced Precipitation Microwave Radiometer (AMPR). • Horizontal plot of relative humidity along the flight path at 6 different altitudes as derived from a combination of three CAMEX-4 ER-2 dropsondes and MM5 model results from a Hurricane Andrew case study. Surface wind speeds were also interpolated. • The 10.7 GHz observations compared to Eddington Forward Radiative Transfer (FRT) calculations using (B) and hydrometeor contents derived from the EDOP observations. The Eddington model was run for 3 cases: Marshall-Palmer (MP) PSD’s with and without a melting layer (ml) and for Grenfell-Warren (GW) ice PSDs without a melting layer. • The 183.3±10 GHz observations compared to Eddington FRT calculations. • These preliminary results show that the Eddington model succeeds reasonably well in modeling liquid hydrometeors. However, the model does a relatively poor job in modeling ice phase microphysics (high frequencies, i.e. the 183 ±10GHz channel). Our initial speculations as to the possible sources of this error include: (1) Lack of sufficient scattering (from ice density or size). (2) Zeroed cloud liquid water content profiles due to lack of available observations, yet super-cooled liquid water will affect high frequency TB. (3) The radar to microphysical content conversion in the frozen regime is not well understood. • This combined data set represents a valuable tool for studying hurricane particle microphysics. • A portion of the work was performed by a NASA GSFC Summer Internship Student.
Hurricane Erin (2001) Data Set (A) EDOP (B) HAMSR (C) HAMSR AMPR (D) Gail Skofronick Jackson Code 975
30-Year satellite record reveals contrasting Arctic andAntarctic decadal sea ice variabilityD. J. Cavalieri and C. L. ParkinsonLaboratory for Hydrospheric Processes, NASA Goddard Space Flight Center, Greenbelt, Maryland K. Y. VinnikovDepartment of Meteorology, University of Maryland, College Park, Maryland • Arctic sea ice extent decreased by 0.30 + 0.03 x 10⁶ km2 /10 yr from 1972 to 2002, but by 0.36 + 0.05 x 10⁶ km2 /10 yr from 1979 to 2002, indicating an acceleration of 20% in the rate of sea ice loss. • Antarctic sea ice extent decreased dramatically from 1973 to 1977 then gradually increased, resulting in an overall decrease at the rate of 0.15 + 0.08 x 10⁶ km2 /10 yr from1973 to 2002. • The accelerated rate of loss of Arctic sea ice may have resulted from the general warming trend in the Arctic as well as from the influence of the strong positive phase of the Arctic Oscillation during the last decade. • The Antarctic trend reversal arises from the large positive anomaly in sea ice extent in the early 1970’s; the gradual increase in ice extent from the late 1970’s may be related to the trend toward more positive Southern Hemisphere annular mode indices resulting in stronger westerlies and cooler temperatures.
30-Year Satellite Record of Arctic and Antarctic Sea Ice Extents D. J. Cavalieri, C. L. Parkinson, and K. Ya. Vinnikov Figure 1. Matched sea ice extents from 1972/3 through 2002 and their anomalies for (a) the Northern Hemisphere and (b) the Southern Hemisphere. Linear ice extent trend lines are indicated for each hemisphere, and a 365-day running mean of the anomalies is included on the anomaly plots. Reference: D. J. Cavalieri, C. L. Parkinson, and K. Ya. Vinnikov, 30-Year satellite record reveals contrasting Arctic and Antarctic decadal sea ice variability, Geophys. Res. Lett., 30(18), 1970, doi:10.1029/2003GL018031, 2003.