Download
1 / 15
150 likes | 168 Vues
Introduction to pulsed field gradient (PFG) NMR and MAS NMR spectroscopy of adsorbed mixtures in metal-organic frameworks (MOFs). Learn about diffusion measurements and spectral resolution for studying molecular mobility and self-diffusivity in MOFs. Discover how MAS PFG NMR enhances diffusometry studies with detailed information on the transfer through nanopores and framework mobility. Explore the remarkable progress in research activities on MOFs for storage, separations, and catalysis applications.

E N D
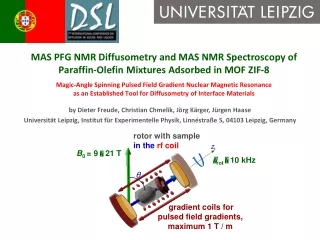
rotor with sample in the rf coil zr B0 = 9 21 T rot 10 kHz θ MAS PFG NMR Diffusometry and MAS NMR Spectroscopy of Paraffin-Olefin Mixtures Adsorbed in MOF ZIF-8Magic-Angle Spinning Pulsed Field Gradient Nuclear Magnetic Resonance as an Established Tool for Diffusometry of Interface Materials by Dieter Freude, Christian Chmelik, Jörg Kärger, Jürgen Haase Universität Leipzig, InstitutfürExperimentellePhysik, Linnéstraße 5, 04103 Leipzig, Germany gradient coils forpulsed field gradients, maximum 1 T / m
B z B B B z z z 0 0 0 0 y y y y 5 1 4 2 M M x x 3 3 1 2 5 4 x x Introduction to pulsed field gradient (PFG) NMR Spin recovery by Hahn echo without diffusion of nuclei: p p /2 r.f. pulse t gradient pulse t gmax = 25 T / m d free induction Hahn echo y magnetization t D D
p/2 p p/2 p/2 p/2 p p/2 rf pulses FID, amplitude S t t t t g gradient pulses d d tecd PFG NMR, signal decay by diffusion of the nuclei PFG NMR diffusion measurements baseon radio frequency (rf) pulse sequences. They generate a spin echo, like the Hahn echo (two pulses) orthe stimulated spin echo (three pulses). At right, a sequence for alternatingsine shaped gradient pulses andlongitudinal eddy current delay (LED) consisting of 7 rf pulses, 4 magnetic field gradient pulses of duration , intensity g, observation time , and 2 eddy current quench pulses is presented. The self-diffusion coefficient D of molecules is obtained from the decay of the amplitude S of the FID in dependence on the field gradient intensity g by the equation
High-resolution solid-state MAS NMR Fast rotation (1-60 kHz) of the sample about an axis oriented at the angle54.7° (magic-angle) with respect to the static magnetic field removes all broadening effects with an angular dependency of zr B0 rot θ Chemical shift anisotropy,internuclear dipolar interactions,first-order quadrupole interactions, and inhomogeneities of the magnetic susceptibility are averaged out. It results an enhancement in spectral resolution by line narrowing for solids and for soft matter. The transverse relaxation time is prolonged.
Example: n-butane + isobutane in zeolite Na-X Example: ethene + ethane in MOF ZIF-8 MAS PFG NMR diffusometry with spectral resolution ωr = 0 kHz 4 2 0 -2 d / ppm δ = 0.02 ppm ωr = 10 kHz 2.0 1.5 1.0 0.5 d / ppm Spectral resolution is necessary for studies of mixture diffusion δ = 0.5 ppm
Potential applications in storage, separations, and catalysis caused a remarkable progress of research activities on metal-organic frameworks (MOFs) [1,2]. The mass transfer of molecular mixtures inside the nanopores and through the outer surface is essential for the applicability of the particular system which is zeoliticimidazolate framework 8 (ZIF-8) [3,4] in the present study. Direct access to the transfer through the outer surface and the mobility in the framework was obtained by our previous IR and interference microscopic investigations [5]. It could be shown that the self-diffusivity exceeds the transport diffusivity if molecular clustering dominates the molecular mobility. For the understanding of the molecular transport detailed information about the self-diffusion of the adsorbed molecules are needed. One of the major differences of MOFs compared to classical nanoporous materials, such as zeolites, is the flexibility of the host lattice. Also for the new MOF subclass of ZIFs (zeoliticimidazolate frameworks) such effects were reported. Gücüyner et al. [6] found a gate-opening effect upon adsorption of an ethene/ethane mixture on ZIF 7. Although a similar effect was not observed in recent permeation measurements through a ZIF 8 membrane for this mixture, the existence of a structural change upon adsorption cannot be ruled out in general. Metal-Organic Frameworks (MOFs) [1] U. Mueller, M. Schubert, F. Teich, H. Puetter, K. Schierle-Arndt, J. Pastre, J. Mater. Chem. 16 (2006) 626-636. [2] G. Feréy and C. Serre, Chem. Soc. Rev., 38 (2009) 1380-1399. [3] H. Bux, F.Y. Liang, Y.S. Li, J. Cravillon, M. Wiebcke, J. Caro, J. Am. Chem. Soc. 131 (2009) 16000-16001. [4] X.C. Huang, Y.Y. Lin, J.P. Zhang, X.M. Chen, Angew. Chem. Int. Ed., 45 (2006) 1557-1559. [5] C. Chmelik, H. Bux, J. Caro, L. Heinke, F. Hibbe, T. Titze, J. Kärger, Phys. Rev. Lett. 104 (2010) 085902. [6] C. Gücüyener, J. van den Bergh, J. Gascon, F. Kapteijn, J. Am. Chem. Soc. 132 (2010) 17704-17706.
ZIF = zeoliticimidazolate framework, ZIF-8↔ SOD Cage-cut: potential landscape mIM bridge window size: ca. 3.4 Å cavity size: ca. 12 Å unit cell: a = b = c 17 Å crystal size: 10 nm … 400 µm synthesis: H. Bux, J. Caro, Hannover
Solid-state NMR spectroscopy and diffusometry Magic-angle spinning NMR spectroscopy on 1H and 13C nuclei in the ZIF-8 framework and in the adsorbed molecules was performed in the field of 17.6 Tesla. Diffusometry on 1H nuclei of the adsorbed molecules and the molecules in the gas phase was done in the temperature range 283-363 K.
ethane ethene 1H MAS NMR spectroscopy 1H MAS NMR spectrum of the as-synthesized MOF ZIF-8 measured at a Larmor frequency of nL =750 MHz, a MAS frequency of nrot = 17 kHz and a temperature of T = 322 K. Asterisks denote spinning side bands. 1H MAS NMR spectrum of a ZIF-8 sample loaded with two ethene and two ethane molecules per cavity. The spectrum was measured at nL =750 MHz,nrot = 10 kHz, T = 303.
13C NMR spectroscopy 13C CP {1H} MAS NMR 13C CP MAS NMR spectrum of the non-loaded (dotted line) ZIF-8 sample and the sample loaded with four molecules ethene plus four molecules ethane per cavity (solid line), measured at nL = 188 MHz, nrot = 10 kHz and T = 303 K. Inlets increase the chemical shift scale by 10. 13C MAS NMR ethane ethene 13C MAS NMR proton decoupled spectrum of the MOF ZIF-8 loaded with four ethene and four ethane molecules p.c., measured at nL = 188 MHz, nrot = 10 kHz, T = 303.
We obtain D = 1.6 × 10⁻⁵ m2s-1 for both, the ethene and ethane, gas phase diffusivities. Diffusometry of gas phase molecules Decay of MOF of the signals of gas phase molecules in ZIF-8 loaded with two ethene and two ethane molecules per cavity, measured at nL =750 MHz, nrot = 10 kHz, T = 303 K with a Hahn-echo pulse sequence with a pulse distance of 10 ms with two mono-polar gradient pulses (after the rf pulses) with a duration of 500 µs. The gradient intensity was varied between 0.0 and 0.1 T m-1. Note the advantage of MAS PFG NMR diffusometry with respect to the PFG NMR diffusometry without spectral resolution: The latter would consider the sum of all unresolved signals for the determination of one averaged self-diffusion coefficient. δ = 0.5 ppm
2D-presentation of the signal decay of MOF ZIF-8 loaded with two ethene and two ethane molecules per cavity, measured at T = 363 K with gradient pulse duration and observation time of 2 ms and 200 ms, respectively. The gradient intensity was varied between 0.05 and 0.5 T m-1. Diffusometry of the adsorbed molecules
Diffusometry of the adsorbed molecules Self-diffusion coefficients, D, of molecules in two mixtures of ethene and ethane molecules adsorbed in MOF ZIF-8 in dependence on T. D is given in units of 10-10 m2s-1 and has a variance of ±10%.
Transport diffusion coefficients DT (triangles in the figure) which were derived in dependence on the concentration c of molecule mixtures ethene/ethane or single-component molecules from gas sorption uptake experiments by infra-red microscopy, IRM, on a large single crystal (300 µm size) at T = 298 K [1, 2]. Diffusometry comparisons Open and solid triangles denote the mixtures and single-components, respectively. Inverted and upright triangles denote ethene and ethane, respectively. The ethene/ethane ratios in the gas mixtures are 1/1.5 and 1.9/1. The latter ratio is denoted by upright bars in the open triangles. The concentration c corresponds to the sum of ethene plus ethane molecules per cage. Solid pentagons on the bottom denote the self-diffusion coefficient of ethane determined by tracer IR microscopy [1]. Solid asterisks (ethene) and solid spheres (ethane) at c = 4 and c = 8 mixture molecules per cage were taken from the MAS PFG NMR data in the table above for 283 and 303 K. [1] C. Chmelik, H. Bux, J. Caro, L. Heinke, F. Hibbe, T. Titze, J. Kärger, Phys. Rev. Lett. 104 (2010) 085902. [2] H. Bux, C. Chmelik, R. Krishna and J. Caro, J. Membr. Sci. 369 (2011) 284-289.
1H and 13C MAS NMR spectroscopy show that there are no by-products or compounds with different short-range order in the synthesis products of ZIF-8. 13C NMR spectroscopy gives a weak hint for a preferential adsorption of the molecules close to the methyl-groups of the imidazole-rings. However, no evidence for a gate-opening effect or another structural change upon adsorption of an ethene/ethane mixture is found. Four well-resolved signals were assigned to ethene and ethane molecules, which are adsorbed in the ZIF-8 crystals or non-adsorbed in the gas phase. The corresponding self-diffusion coefficients could be determined separately. • The microscopic MAS PFG NMR diffusivities are in agreement with the mesoscopic diffusivities of IR microscopy. The diffusion selectivity is Dethene:Dethane = 5.5 at a loading of 4 molecules per cavity by both techniques. By accounting for the influence of the thermodynamic factor IRM transport diffusivities and NMR self-diffusivities could be directly transferred into each other. The latter is expected only for porous structures consisting of large cavities with narrow windows. The agreement between the results from both techniques is exceptionally good, if we consider the uncertainties in the determination of the absolute concentration and the diffusivities and the fact that crystals from different batches were investigated. • The different diffusivities of ethene and ethane can be rationalized by the different size of molecules. This conclusion is supported by the higher activation energies of ethane diffusion compared to ethene. A possible difference in the guest-host interaction between the saturated and non-saturated molecule has no impact on the mobility of the molecules. • MAS PFG NMR gives access to a multitude of different aspects of guest diffusion and adsorption. In particular if combined with non-equilibrium methods as IR microscopy a most detailed picture on molecular transport can be obtained which facilitates its understanding on a molecular level. • Article in Press: Christian Chmelik, Dieter Freude, Helge Bux, Jürgen Haase, Micropor. Mesopor. Mater. (2011), doi:10.1016/j.micromeso.2011.06.009 Conclusions