Download

1 / 36
380 likes | 564 Vues
Dive into the fundamental concepts of economics with this comprehensive guide, exploring topics like opportunity cost, marginalism, and efficient markets. Gain insights into how economics influences society, global affairs, and the decisions we make as informed citizens.

E N D
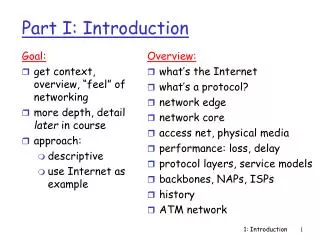
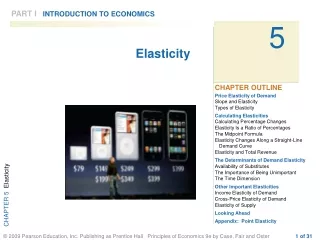
PART IINTRODUCTION TO ECONOMICS 1 The Scope andMethod of Economics CHAPTER OUTLINE Why Study Economics? To Learn a Way of Thinking To Understand Society To Understand Global Affairs To Be an Informed Citizen The Scope of Economics Microeconomics and Macroeconomics The Diverse Fields of Economics The Method of Economics Descriptive Economics and Economic Theory Theories and Models Economic Policy An Invitation Appendix: How to Read and Understand Graphs
economicsThe study of how individuals and societies choose to use the scarce resources that nature and previous generations have provided. Scarce :Limited. Chooseis one of the key word in this definition. Economics is a behavioral and social science. In large measure, it is the study of how people make choices. The choices that people make, when added up, translate into societal choices. 2 of 37
Economics has three fundamental concepts: Opportunity cost Marginalism Efficient markets To Learn a Way of Thinking Why Study Economics? The study of economics teaches us a way of thinking and may help us make decisions.
To Learn a Way of Thinking Why Study Economics? Opportunity Cost (1/3) opportunity cost The best alternative that we forgo, or give up, when we make a choice or a decision. Example: undergraduate degree vs job market; take a summer course or travel abroad, etc.
To Learn a Way of Thinking Why Study Economics? Marginalism (2/3) marginalism :The process of analyzing the additional or incremental costs or benefits arising from a choice or decision.Example: 1/The pleasure you get from eating a second burger is less than the first. 2/The 10th cup of coffee is likely to send you to hospital! sunk costs: Costs that cannot be avoided because they have already been incurred. Example: 1/some airlines charge very low “bargain” price for airline tickets because the flight is a sunk cost (additional cost of ticket is zero) 2/ Developing and selling video games.
To Learn a Way of Thinking Why Study Economics? Efficient Markets—No Free Lunch (3/3) efficient marketA market in which profit opportunities are eliminated almost instantaneously. Example: Queuing at the supermarket.
To Understand Society Why Study Economics? The study of economics is an essential part of the study of society. Industrial revolutionThe period in England and France during the late 1700 and early 1800 centuries in which new manufacturing technologies and improved transportation gave rise to the modern factory system and a massive movement of the population from the countryside to the cities. Internet revolution (since 1990s)
To Understand Global Affairs Why Study Economics? An understanding of economics is essential to an understanding of global affairs. Example the impact of the fall in the price of oils in the summer of 2014. To Be an Informed Citizen To be an informed citizen requires a basic understanding of economics. Example: 1/ effect of employment permits to foreigners; 2/ the effects of the wage increases on prices and inflation; 3/ off-shore gas; 4/ wealth inequality etc.
Microeconomics and macroeconomics The Scope of Economics microeconomicsThe branch of economics that examines the functioning of individual industries and the behavior of individual decision-making units—that is, firms and households. macroeconomicsThe branch of economics that examines the economic behavior of aggregates—income, employment, output, and so on—on a national scale. Microeconomics looks at the individual unit—the household, the firm, the industry. It sees and examines the “trees.” Macroeconomics looks at the whole, the aggregate. It sees and analyzes the “forest.”
Microeconomics and Macroeconomics The Scope of Economics
The Diverse Fields of Economics The Scope of Economics Continued...
The Diverse Fields of Economics The Scope of Economics Continued...
The Diverse Fields of Economics The Scope of Economics
E C O N O M I C S I N P R A C T I C E Trust and Gender While many transactions happen in anonymous markets in which buyers and sellers don’t know one another, there are many other occasions in which markets operate more effectively if individuals develop some trust in one another. Economists who analyzed an investment experimental games found differences between the behaviors of males and females. In this investment game a sender and a receiver each have 10$. The sender can send any amount of money to the responder. This money is tripled when it reaches the responder who can send any amount of money back. If no money is sent, each keeps10$. But if the 10$ are sent money is created and the total money available is 40$. The game requires trust, the sender trusts that the responder will send some of the money back. The researchers found that that men trust more than women [they send more money] and women are more trustworthy than men [they return more money].” On average across all conditions, male senders sent $7.80 while female senders sent $6.66 while female responders return 33.2% of their funds across all conditions while male responders return 28.8%
The Method of Economics Positive economicsAn approach to economics that seeks to understand behavior and the operation of systems. It describes what exists and how it works. Descriptive economicsis part of positive economics and involves the compilation of data that describe phenomena and facts. Normative economicsAn approach to economics that analyzes outcomes of economic behavior, evaluates them as good or bad, and may prescribe courses of action.
The Method of Economics Policy economics depends on both normative and positive economics. Positive and normative cannot be neatly separated and they are entangled: Normative economics needs positive economics and positive economics is never free from normative assumptions.
Theories and Models (positive economics) The Method of Economics economic theoryA statement or set of related statements about cause and effect, action and reaction. Empirical economicsThe collection and use of data to test economic theories. VariableA measure that can change from time to time or from observation to observation.
Theories and Models (positive economics) The Method of Economics ModelA formal statement of a theory, usually a mathematical statement of a presumed relationship between two or more variables (think of a map or a toy as models). Ockham’s razorThe principle that irrelevant detail should be cut away.
The Method of Economics Theories and Models (positive economics) All Else Equal: Ceteris Paribus ceteris paribus, or all else equalAn assumption used to analyze the relationship between two variables while assuming the values of other variables are held unchanged. Using the device of ceteris paribusis one part of the process of abstraction. In formulating economic theory, ceteris paribushelps us simplify reality to focus on the relationships that interest us.
The Method of Economics Theories and Models (positive economics) Expressing Models in words, graphs, and equations • Methods of expressing the quantitative relationship between two variables: • Graphing(as presented in appendix) • Equations, for example: If over time U.S. households collectively consume 90 percent of their income and save 10 percent of their income we can express this as: where C is consumption, Y is income, and S saving. C = .90 Y and S = .10Y
The Method of Economics Theories and Models (positive economics) Cautions and Pitfalls The Post Hoc Fallacy or “after this (in time), therefore because of this.” A common error made in thinking about causation: If event A happens before event B, it is not necessarily true that A caused B. Example: rooster and sun rising; car wash and rain (because I washed my car, it rains); vaccination and autism.
The Method of Economics Theories and Models (positive economics) Cautions and Pitfalls The Fallacy of Composition The erroneous belief that what is true for a part is necessarily true for the whole. Example: driving to work or, again, vaccination (if I do not get my children vaccinated they will be measles free because everybody else is vaccinated, but if everybody else stops receiving vaccination this will no longer be true)
E C O N O M I C S I N P R A C T I C E Does Your Roommate Matter for Your Grades? A study of causation. Do your friends influence your behavior or do you select friends that have the same behavior as you? Several recent economics studies of the effect of roommates on college grades help to sort out causality in peer effects. Bruce Sacerdote, a professor at Dartmouth college—one of many schools that randomly assign roommates to freshmen—used data on freshmen academic and social performance, combined with their background data, to test the peer effects from different types of roommates. He found strong roommate effects on grade point average, effort in school, and fraternity membership. This means that even if you select friends with the same behavior as you, they will influence and change your behavior.
The Method of Economics Economic Policy (normative economics) Criteria for judging economic outcomes: 1. Efficiency 2. Equity 3. Growth 4. Stability
The Method of Economics Economic Policy (normative economics) Efficiency efficiencyIn economics, we care about allocative efficiency. An efficient economy is one that produces what people want at the least possible cost. Equity equityfairness & justice.
The Method of Economics Economic Policy (normative economics) Growth economic growthAn increase in the total output of an economy. Stability stabilityA condition in which national output is growing steadily, with low inflation and full employment of resources.
An Invitation You cannot begin to understand how a society functions without knowing something about its economic history and its economic system. Learning to think in this way will help you better understand the world. As you proceed, it is important that you keep track of what you have learned in earlier chapters. This book has a plan; it proceeds step-by-step, each section building on the last. Make sure you understand where it fits in the big picture.
R E V I E W T E R M S A N D C O N C E P T S marginalism microeconomics model normative economics Ockham’s razor opportunity cost positive economics post hoc, ergo propter hoc scarce stability sunk costs variable ceteris paribus,or all else equal descriptive economics economic growth economic theory economics efficiency efficient market empirical economics equity fallacy of composition Industrial Revolution macroeconomics
A graph is a two-dimensional representation of a set of numbers, or data. A time series graph shows how a single measure or variable changes over time. CHAPTER 1 APPENDIX How to Read and Understand Graphs Time Series Graphs Cross Section Graphs A cross section graph shows how two variables change over a single point in time.
Appendix CHAPTER 1 APPENDIX How to Read and Understand Graphs Graphing Two Variables on a Cartesian Coordinate System FIGURE 1A.2A Cartesian Coordinate System A Cartesian coordinate system is constructed by drawing two perpendicular lines: a vertical axis (the Y-axis) and a horizontal axis (the X-axis). Each axis is a measuring scale.
FIGURE 1A.1Total Disposable Personal Income in the United States: 1975–2012 (in billions of dollars)
CHAPTER 1 APPENDIX How to Read and Understand Graphs Plotting Income and Consumption Data for Households FIGURE 1A.3 Household Consumption and Income A graph is a simple two-dimensional geometric representation of data. This graph displays the data from Table 1A.2. Along the horizontal scale (X-axis), we measure household income. Along the vertical scale (Y-axis), we measure household consumption. Note: At point A, consumption equals $22,304 and income equals $10,263. At point B, consumption equals $31,751 and income equals $27,442.
CHAPTER 1 APPENDIX How to Read and Understand Graphs Slope FIGURE 1A.4 A Curve with (a) Positive Slope and (b) Negative Slope A positive slope indicates that increases in X are associated with increases in Y and that decreases in X are associated with decreases in Y. A negative slope indicates the opposite—when X increases, Y decreases; and when X decreases, Y increases.
CHAPTER 1 APPENDIX How to Read and Understand Graphs Slope FIGURE 1A.5 Changing Slopes along Curves
CHAPTER 1 APPENDIX Some Precautions FIGURE 1A.6 National Income and Consumption It is important to think carefully about what is represented by points in the space defined by the axes of a graph. In this graph, we have graphed income with consumption, as in Figure 1A.3, but here each observation point is national income and aggregate consumption in different years, measured in billions of dollars.
A P P E N D I X R E V I E W T E R M S A N D C O N C E P T S Cartesian coordinate system graph negative relationship origin positive relationship slope time series graph X-axis X-intercept Y-axis Y-intercept