Quadratic Functions and Models
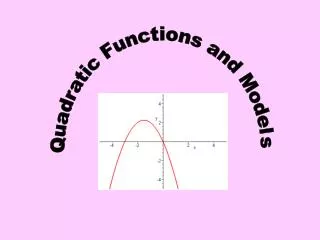
Quadratic Functions and Models. If a > 0 the parabola opens up and the larger the a value the “narrower” the graph and the smaller the a value the “wider” the graph.

Quadratic Functions and Models
E N D
Presentation Transcript
If a > 0 the parabola opens up and the larger the a value the “narrower” the graph and the smaller the a value the “wider” the graph. If a < 0 the parabola opens down and the larger the a the “narrower” the graph and the smaller the a the “wider” the graph.
The graph of this function is a parabola vertical shift, moves graph vertically by k Determines whether the parabola opens up or down and how “wide” it is horizontal shift, moves graph horizontally by h We need to algebraically manipulate this to look like the form above. We’ll do this by completing the square. This will factor into (x-3)(x-3) so we can express it as something squared and combine the -1 and -9 on the end. Let’s look at a quadratic function and see if we can graph it. 9 9 Subtract it here to keep things equal (can’t add a number without compensating for it and we don’t want to add it to the other side because of function notation) Add a number here to make a perfect square
We started with and completed the square to get it in the format to be able to graph using transformations. down 10 right 3 We can take the general quadratic equation and do this to find a formula for the vertex. What we find from doing this is on the next slide.
Let’s try this on the one we did before: 1 The x value of the vertex of the parabola can be found by computing (-6) The vertex is then at (3, -10) (1) The y value of the vertex of the parabola can be found by substituting the x value of the vertex in the function and finding the function value.
Let’s plot the vertex: Since the a value is positive, we know the parabola opens up. The parabola will be symmetric about a vertical line through the vertex called the axis or line of symmetry. (0, -1) (6, -1) (3, -10) Let’s find the y intercept by plugging 0 in for x. The graph is symmetric with respect to the line x = 3 so we can find a reflective point on the other side of the axis of symmetry. So y intercept is (0, -1) We can now see enough to graph the parabola
Let’s look at another way to graph the parabola starting with the vertex: We could find the x intercepts of the graph by putting f(x) (which is the y value) = 0 This won’t factor so we’ll have to use the quadratic formula. (3, -10) So x intercepts are (6.2, 0) and (- 0.2, 0)
We can find the x value of the vertex by computing A mathematical model may lead to a quadratic function. Often, we are interested in where the function is at its minimum or its maximum. If the function is quadratic the graph will be a parabola so the minimum (if it opens up) will be at the vertex or the maximum (if it opens down) will be at the vertex. We could then sub this value into the function to find its minimum or maximum value.
DEMAND EQUATION The price p and the quantity x sold of a certain product obey the demand equation: This is the real world domain. The equation doesn’t make sense if the quantity sold is negative (x < 0) and it doesn't make sense if the price is negative (if x > 400) Express the revenue R as a function of x. Revenue is the amount you bring in, so it would be how much you charge (the price p) times how many you sold (the quantity x)
This is a quadratic equation and since ais negative, its graph is a parabola that opens down. It will have a maximum value then at the y value of the vertex. What is the revenue if 100 units are sold? What quantity x maximizes revenue? Since the revenue function is maximum at the vertex, we'll want to find the x value of the vertex to answer this. What is the maximum revenue? This would be the y value of the vertex
DEMAND EQUATION The price p and the quantity x sold of a certain product obey the demand equation: What price should the company charge to receive maximum revenue? Since we just found that the quantity to achieve maximum revenue was 200, we can substitute this in the price equation to answer this question.
Acknowledgement I wish to thank Shawna Haider from Salt Lake Community College, Utah USA for her hard work in creating this PowerPoint. www.slcc.edu Shawna has kindly given permission for this resource to be downloaded from www.mathxtc.com and for it to be modified to suit the Western Australian Mathematics Curriculum. Stephen Corcoran Head of Mathematics St Stephen’s School – Carramar www.ststephens.wa.edu.au