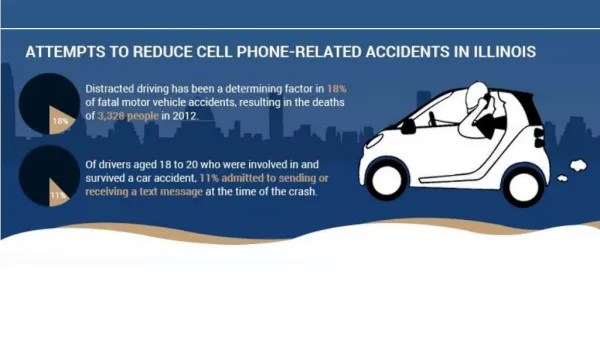
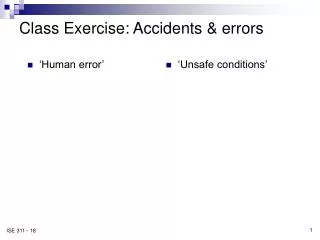
Class Exercise: Accidents & errors
‘Human error’. ‘Unsafe conditions’. Class Exercise: Accidents & errors. Goals of safety engineering/management. Reduce errors Reduce proportion of errors that become accidents Reduce proportion of accidents that become injuries Reduce lost days/injury. Injury and severity rate.

Class Exercise: Accidents & errors
E N D
Presentation Transcript
‘Human error’ ‘Unsafe conditions’ Class Exercise: Accidents & errors
Goals of safety engineering/management • Reduce errors • Reduce proportion of errors that become accidents • Reduce proportion of accidents that become injuries • Reduce lost days/injury
Injury and severity rate • Injury rate = Injury cases/yr× 200,000 ÷ Actual hrs worked/yr • Severity rate = Days charged ÷ Injury cases/yr Unsafe conditions Unsafe acts Injury rate
Selection of problems • Decision method: • Multiply frequency rate for each type of accident by the severity rate. • Consider refining by including dollar cost/case. • Rank order annual costs. • Consider using a Pareto analysis. • Examine high-energy sources.
Open Manhole Analogy • The engineering approach is most effective and is permanent. ‘Warning’ approach ‘Guarding’ approach Engineering approach
Reduction of Unsafe Conditions • Reduce human error • Reduce equipment failure • Design the proper control, display, and environment • Use distance • Use guards • Use time
Unsafe acts • Treat all accidents as unsafe conditions. • Unsafe acts may result from: • Lack of knowledge • Deliberate risk • Drug effects • Address the causes .. • Lack of knowledge • Deliberate risk • Drug effects
Warnings • Are information about a possible negative consequence. • An effective warning should change behavior. • May be visual, auditory, or vibratory. • Need increases when: • Injury potential increases • Danger is less obvious • Injury onset is not obvious • More people are exposed
Problems with Warnings P The information must be Present. R The warning must be Read. U The reader must Understand the warning. M The information must remain in Memory. A The person must Act on the information. E The warning must be Effective (the person must be able to perform the desired behavior).
Fault Tree Analysis (FTA) • Fault Tree: A graphic “model” of the pathways within a system that can lead to a foreseeable, undesirable loss event. • The pathways interconnect contributory events and conditions, using standard logic symbols. • Numerical probabilities of occurrence can be entered and propagated through the model to evaluate probability of the foreseeable, undesirable event.
FTA is best applied to cases with … • Large, perceived threats of loss, i.e., high risk. • Numerous potential contributors to a mishap. • Complex or multi-element systems/processes. • Already-identified undesirable events (a must!) • Indiscernible mishap causes (i.e., autopsies.) • Caveat: Large fault trees are resource-hungry and should not be undertaken without reasonable assurance of need.
FTA produces: • Graphic display of chains of events/conditions leading to the loss event. • Identification of those potential contributors to failure that are “critical.” • Improved understanding of system characteristics. • Qualitative/quantitative insight into probability of the loss event selected for analysis. • Identification of resources committed to preventing failure. • Guidance for redeploying resources to optimize control of risk. • Documentation of analytical results.
Some definitions • FAULT • An abnormal undesirable state of a system or a system element induced 1) by presence of an improper command or absence of a proper one, or 2) by a failure (see below). All failures cause faults; not all faults are caused by failures. A system which has been shut down by safety features has not faulted. • FAILURE • Loss, by a system or system element, of functional integrity to perform as intended, e.g., relay contacts corrode and will not pass rated current closed, or the relay coil has burned out and will not close the contacts when commanded – the relay has failed; a pressure vessel bursts – the vessel fails. A protective device which functions as intended has not failed, e.g, a blown fuse.
Assumptions and limitations • Non-repairable system. • No sabotage. • Markov… • Fault rates are constant. • The future is independent of the past – i.e., future states available to the system depend only upon its present state and pathways now available to it, not upon how it got where it is. • Bernoulli… • Each system element analyzed has two, mutually exclusive states.
The logic symbols (see also table 18.4, pg. 360) Most Fault Tree Analyses can be carried out using only these four symbols. Events and Gates are not component parts of the system being analyzed. They are symbols representing the logic of the analysis.
Steps in FTA 1 Identify undesirable TOP event. 3 Link contributors to TOP by logic gates. 2 Identify first level contributors. 5 Link contributors to events by logic gates. 4 Identify 2nd level contributors. 6 Repeat/continue.
Use FTA to … • Identify probability of failures and faults. • Identify candidates for engineering solutions. • Identify common causeevents … • Events which, if they occur, will cause two or more fault tree events to occur. • Typical common cause events include power failures, dust & grit, temperature effects (freezing/overheating), operator oversight, etc. • Can be overcome through redundant systems, isolation or shielding, etc.
Your turn … • Identify a specific potential occurrence using a product, tool, or piece of equipment with which you are familiar (enough to analyze the occurrence in detail.) • Conduct a FTA using this occurrence as the top-level event.
Failure Modes & Effects Analysis, FMEA • Evaluates reliability and identifies single-point failures that can lead to systems failure. • Functional vs hardware FMEA: • used early in design programs • top-level, focus on systems and subsystems • Hardware FMEA: • based on detailed design data • concentrates on assemblies, subassemblies, and components • Limitations – FMEA doesn’t address • operational interface • multiple failures • human factors
Three key questions to be answered by the FMEA process: • What could fail in each component of my product or design? • To what extent might it fail and what are the potential hazards produced by the failure? • What steps should be implemented to prevent failures?
The FMEA process • Define the system • Identify potential failure modes & their causes • Evaluate the effects on the system of each failure mode • Identify failure detection methods • Identify corrective measures for failure modes • Document analysis / prepare FMEA report
Your Turn … • Define the system • Identify a product with which you are familiar (enough to perform an analysis of failure modes.) • Identify one part on that product to analyze in detail. • (NOTE: use the attached FMEA form for this exercise.)
FMEA Form and Definitions Design FMEA Analysis ∆ = Critical characteristic which may effect safety, compliance with Gov. regulations, or require special controls. SEV = Severity rating (1 to 10) OCC = Occurrence frequency (1 to 10) DET = Detection Rating (1 to 10) RPN = Risk Priority Number (1 to 1000) = SEV * OCC * DET
Your turn … • Identify potential failure modes & their causes • Identify 2 – 3 potential failure modes and what could cause them. • Evaluate the effects on the system of each failure mode Identify 2 – 3 potential failure modes and what could cause them. • Using the table on the following page, evaluate the potential severity of each failure mode.
Your turn … • Identify failure detection methods • How would you as the user/operator of this product recognize that the part has failed or is about to fail? • Use the OCC table on the following page to evaluate the probability of failure occurrence. • Identify corrective measures for failure modes • Do you know how to correct the fault to restore safe and correct operation of the product? • Use the DET table to evaluate the probability of detecting the failure.
Your turn … • Document analysis / prepare FMEA report • Calculate the risk priority number, RPN = SEV * OCC * DET • Recommend action based on the RPN.


![[Exercise Name]](https://cdn2.slideserve.com/4369850/exercise-name-dt.jpg)