Download
1 / 22
220 likes | 870 Vues
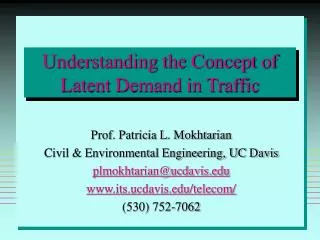
Understanding the Concept of Latent Demand in Traffic. Prof. Patricia L. Mokhtarian Civil & Environmental Engineering, UC Davis plmokhtarian@ucdavis.edu www.its.ucdavis.edu/telecom/ (530) 752-7062. Outline of this Talk. What are latent and induced demand, and their implications?

E N D
Understanding the Concept of Latent Demand in Traffic Prof. Patricia L. Mokhtarian Civil & Environmental Engineering, UC Davis plmokhtarian@ucdavis.edu www.its.ucdavis.edu/telecom/ (530) 752-7062
Outline of this Talk • What are latent and induced demand, and their implications? • Empirical approaches to assessing induced demand • Typical results • Limitations • UC Davis study using matched pairs • More recent work: Cervero/Hansen & Choo/Mokh. • Summary • Concluding thoughts
What is Latent Demand? • Often used interchangeably with “induced demand”, but the two concepts can be technically distinguished as follows: • Latent demand: Pent-up (dormant) demand for travel, travel that is desired but unrealized because of constraints • Induced demand:Realized demand that is generated (induced, “drawn out”) because of improvements to the transportation system
Induced Demand • The increment of new vehicle traffic that would not have occurred at all without the capacity improvement. • Clear in theory, but difficult in practice! • Observed increases in traffic on a capacity-enhanced network link can arise from a variety of sources:
When is Traffic Growth Induced Demand? • Shifts in departure time • Changes in route or destination (no for vehicle trips but maybe for VMT) • Shifts from shared modes to drive alone • New or longer trips to existing locations • Background demographic growth (WHOA) • Trips generated by new development attracted to the improved corridor
Why do we Care about Induced Demand? • Need to be able to forecast newly-created travel (that WNHOA): • Affects the cost-benefit calculation for the improvement • Affects the assessment of environmental impacts • Legal/political ramifications: • Sierra Club v. MTC, 1989 • UK abandoned “predict and provide” policy in mid ’90s
Empirical Approaches • Case studies • Cross-sectional disaggregate modeling • Cross-sectional aggregate modeling • Time series aggregate modeling • Cross-sectional/time series aggregate modeling • Time series link/facility level analysis with controls
Case Studies • Change in traffic on single facility measured • Results mixed, but have generally found observed volumes higher than forecasts • May highlight idiosyncratic circumstances • Often short-term; difficult to distinguish induced demand from shifted demand or background growth
Cross-sectional Disaggregate Modeling • Using 1995 NPTS (travel diary data), analyze association of VMT with speed • Higher speeds associated with greater VMT • Speed is a more behaviorally-sound influence on VMT than capacity • Association doesn’t guarantee causality; can’t identify long-term impacts
Cross-sectional Aggregate Modeling • Models impact of lane-miles on VMT for metro areas in US • Increase of 1% in lane-mi leads to ~0.8% increase in VMT • Potentially represents long-term equilibrium • Bi-directional causality impossible to untangle with single equation, no dynamic element
Time Series Aggregate Modeling • Decomposed VMT growth (Milwaukee, 1963-1991) into sources based on assumed relationships • 6-22% of total VMT growth attributable to new capacity • Regional focus; decomposition approach useful • Still only one direction of causality permitted
Cross-sectional/Time Series Aggregate Modeling • Models VMT as function of lane-mi among other variables, for multiple areas over time • 1% increase in ln-mi → 0.2 – 0.9% increase in VMT (long-run > short-run) • Advantages: • Covariates help capture background influences • If area large enough, demand shifts accounted for • Temporal precedence can be established
Cross-sectional/Time Series Aggregate Modeling (cont’d) • Disadvantages: • Not all background influences captured • Facility/metro-level analyses subject to confounding with changes in classification and urban boundary over time • Even temporal precedence doesn’t guarantee causality • Effectiveness of lagged variables depends on whether planning horizon is longer than the lag
Time Series Link/Facility Level Analysis with Controls • Compares growth in ADT on improved links, to that on matched set of unimproved links • Study of 18 matched prs in CA (UCD faculty) found no difference in growth rates • Controls for causes of growth common to improved and comparison segments • Several disadvantages:
Time Series Link/Facility Level Analysis (cont’d) • Disadvantages: • Difficult to find suitable controls • Doesn’t control for spatial shifts from nearby • Cannot establish a control for an entirely new link • Another possible reason for difference: ADT v. VMT: new capacity may affect trip length more than frequency
Recent Work: Cervero/Hansen • Cross-sectional/time series aggregate • state hwys, 34 CA counties, 1976-97 • Simultaneous equations: • Lane-miles → VMT • VMT → lane-miles • Both directions of causality significant, lane-miles → VMT the stronger direction
Cervero/Hansen (cont’d) • Probably the most rigorous published study to date • Issues: • Did facility reclassification, metro area effects confound relationships? • What happened to traffic on lower-classification facilities? • Are the instrumental variables appropriate? • Is the high goodness-of-fit spurious? • Were the lags long enough?
Recent Work: Choo/Mokhtarian • Time series aggregate (USwide, 1951-2000) • Comprehensive structural model
Endogenous Variable Category Exogenous Variable Category Sociodemo-graphics Economic Activity Travel Demand (VMT) Transport.Sys. Infrastructure (lane-mi) Telecom Demand Telecom System Infrastructure Telecom Costs Travel Costs Land Use
Choo/Mokhtarian (cont’d) • Time series aggregate (USwide, 1951-2000) • Comprehensive structural model • Corrected for high correlations due to similar temporal trends • Also found both directions of causality significant, lane-miles → VMT the stronger direction
Summary • It’s a complex issue! • Each approach has advantages and disadvantages, something to offer but not definitive answers • To better understand extent to which answer depends on method, apply multiple methods to same region • Nevertheless, the most sophisticated analyses find evidence for induced demand
Concluding Thoughts • Transportation demand will continue to grow • Thus, can’t eliminate all system improvements just because demand will increase • Should rather weigh the costs (increased fuel consumption, emissions) against the benefits (increased mobility, economic gain) • Need to continue to improve our measurement and modeling of both costs and benefits • And continue efforts to more appropriately price the provision of service