Download
1 / 31
310 likes | 414 Vues
Explore an LCRT value audit of an approved list, detailing empirical evidence on valuations, suggested changes, and analyzing over/undervalued firms. Evaluate portfolio processes and understand the impact of intrinsic value charts.

E N D
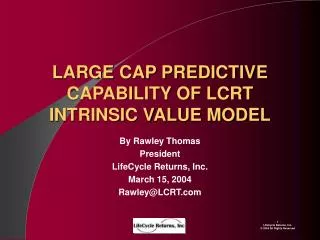
LCRT VALUE AUDIT OF AN APPROVED LIST By Rawley Thomas President LifeCycle Returns, Inc. July 14, 2004 Rawley@LCRT.com LCRT Value Audit of An Approved List 7-18-04.ppt
PRESENTATION OUTLINE • Nobel Prize Winning Academic empirical evidence on valuation inefficiency and application to LCRT Intrinsic Value Charts • LCRT Value Audit Purpose – Change Portfolio Decision Processes • Analysis of Approved List for Under (Over) Valued Firms • Suggested Changes in Processes • Analysis of Approved List Using Other Portfolio Metrics
IN A CAREFULLY CONTROLLED EXPERIMENT IN AN ECONOMICS LABORATORY, VERNON SMITH et. al. DEMONSTRATES SIGNIFICANT DIFFERENCES OF TRADED PRICES FROM KNOWN INTRINSIC VALUES IN VOILATION OF THE EFFICIENT MARKETS HYPOTHESIS (Vernon Smith won the Nobel Prize for this and other work.) Vernon L. Smith, Gerry L. Suchanek, and Arlington W. Williams, “Bubbles, Crashes, and Endogenous Expectations in Experimental Spot Asset Markets,” in Vernon Smith, Papers in Experimental Economics, Cambridge University Press, Cambridge, 1991, pp. 339-371, chart from p. 352.
NOTICE THE SAME PATTERN IN AN INTRINSIC VALUE CHART WHICH ENABLES US TO VISUALIZE THE MEASUREMENT OF ACCURACY OF A DCF MODEL PRICE LEVELUSING ONLY ACTUAL REPORTED FINANCIAL DATA AND THE SAME GLOBAL PARAMETERS ACROSS THE ENTIRE UNIVERSE TO DRIVE A MECHANICAL LIFE CYCLE FORECAST OF CASH FLOWS FOR EACH COMPANY Notice the large high low variation around the intrinsic valuations, providing opportunity for profitable trading The Absolute “Tracking” Error Intrinsic Value vs. Actual Equals the Absolute Geometric Mean Error Between The Intrinsic Value Red Line And Closing Prices at Fiscal Year + 3 Months (hollow circles) Over the Number of Years Forecasts reflect the combination of Analysts’ Consensus Sales and EPS Estimates Combined With the LCRT DCF Model, Assuming the Same Capital Turnover and Non-Earnings Margins of the Most Recent Historical Year, Discounted to the Most Recent Month
LCRT VALUE AUDIT PURPOSE:CHANGE PORTFOLIO DECISION PROCESSES • Universe • 1,000 Largest Companies by Market Cap • Approved List • 84 Firms • Change Decision PROCESSES by providing quantitative feedback on the valuation metric characteristics of the companies currently included in the approved list compared to the Universe of firms from which that portfolio was drawn
Methodology Sort companies by key portfolio metric (market cap here) Plot each firm’s position within the cumulative distribution against the portfolio metric Compare portfolio distribution against the universe from which it was drawn (next slide) MARKET CAP WITH TICKERS Approved List
THE APPROVED LIST FAVORS MOSTLY LARGER FIRMS Universe Approved List
USING THE LCRT DCF MODEL, 57% OF THE APPROVED LIST IS OVER-VALUED AND 72% (100-28) IS MORE OVER-VALUED THAN THE UNIVERSE • Any one of the following three hypotheses could be true: • 1. Approved List may pick more “losers” than “winners” • 2. OR Approved List may pick more “winners” than “losers” • 3. OR Employing both the Approved List and LCRT’s valuation may pick more “winners” than “losers” • Empirical Tests to distinguish which Hypothesis of the three is most true • Translate each dimension of the beliefs used to produce the Approved List into testable valuation models • Back test each model’s accuracy and predictive capability • Test combination of Approved List implicit valuation models and LCRT • Feedback from the empirical results will improve the stock selection PROCESS Approved List Universe 57 28 = 100 – 72
REVIEWING THE TICKERS OF THE UNDER (OVER) VALUED FIRMS SHOULD HELP PORTFOLIO MANAGERS RE-EVALUATE THEIR IMPLICIT VALUATION BELIEFS • Review each company to determine why it was selected for inclusion in the Approved List • Translate the reasons into implicit valuation models for empirical testing • Try the discipline of picking a “loser” for every “winner” based on a detailed analysis of each firm’s competitive strategy, business model, and management processes to extend the possibility of longer holding periods for each stock purchased • Each week, month, and quarter, assess whether the “winners” and “losers” are on track with the strategic analysis based on earnings revisions and surprises • Measure daily and weekly market sentiment to determine if firm prices are signaling discontinuous fundamental change OR are just noise around intrinsic valuations Approved List
A BETTER EXPLANATORY MODEL IS MORE PREDICTIVE Like golf, lower scores indicate more accuracy. These results support the intuition of HOLT’s clients, who in the late 1980’s said, “I only employ the model for buy/sell decisions when it tracks well.” “Few strokes separate the best from the worst professional golfers.” LCRT Intrinsic Value Model OLS Least Absolute Deviation R2 = 0.473 N = 2,752 This chart violates the instantaneously efficient market hypothesis. It represents an “anomaly” consistent with behavioral finance theory.
REVIEWING THE TICKERS OF THE UNDER (OVER) VALUED FIRMS SHOULD HELP PORTFOLIO MANAGERS IDENTIFY BUY AND SELL CANDIDATES • Determine if the LCRT DCF model can be trusted for a particular firm by reviewing the tracking errors on the intrinsic value chart based on the following super sector medians for cutoffs • < 30-50% for Industrials • < 10-20% for Banks • < 20-30% for Non-Bank Financials and Utilities • If the tracking error exceeds the cutoff, determine if other firms in the same industry or with the same economic characteristics track poorly • Determine reasons why • Company specific data OR • General pattern affecting the LCRT DCF Model Structure • Employ company specific overrides to test hypotheses to improve tracking OR Rely on other non-LCRT valuation techniques • Please provide these analyses and insights to LCRT for further research and enhancements to the Platform • To find additional buy and sell names for review, use LCRT Extract to filter companies satisfying your universe screen and tracking errors under the super sector cutoffs
COMBINING FREE CASH FLOW AND LCRT SCREENS SEPARATE “WINNERS” FROM “LOSERS” BY 17.0% = (-.45-(-17.50) AND ILLUSTRATES HOW VALUATION BELIEFS UNDERLYING THE APPROVED LIST MIGHT BE COMBINED WITH LCRT TO ACHIEVE GREATER RESULTS THAN EITHER SEPARATELY FCF “Winners” & LCRT “Winners” Median = -0.45% N = 7,074 Company-Years FCF “Losers” & LCRT “Winners” Median = -7.74% N = 1,527 Company-Years FCF “Winners” & LCRT “Losers” Median = -7.54% N = 2,212 Company-Years FCF “Losers” & LCRT “Losers” Median = -17.50% N = 6,320 Company-Years
THE DISTRIBUTION OF THE CER FOR THE APPROVED LIST FOLLOWS THE UNIVERSE CLOSELY, MEANING THE PORTFOLIO WILL FOLLOW THE MARKET FOR CHANGES IN THE REAL INVESTOR’S DISCOUNT RATE Universe Approved List
THE APPROVED LIST FAVORS FIRMS WITH LESS CER MOMENTUM THAN THE UNIVERSE Approved List Universe
DUE TO CASH AND INFLATION DISTORTIONS, THE NOMINAL ROCE FOR THE APPROVED LIST EXCEEDS THE UNIVERSE, WHILE THE CER DOES NOT;PORTFOLIO MANAGERS MAY USE THE HIGHER ROCE’S TO JUSTIFY HIGHER VALUATIONS, WHILE THE CASH ECONOMIC RETURNS SUGGEST OTHERWISE Universe Universe Approved List Approved List
DUE TO CASH, INFLATION, AND LEVERAGE DISTORTIONS, THE NOMINAL ROE FOR THE APPROVED LIST EXCEEDS THE UNIVERSE, WHILE THE CER DOES NOT;PORTFOLIO MANAGERS MAY USE THE HIGHER ROE’S TO JUSTIFY HIGHER VALUATIONS, WHILE THE CASH ECONOMIC RETURNS SUGGEST OTHERWISE Universe Approved List Universe Approved List
THE APPROVED LIST POSSESES LONGER PLANT LIVES AND A NARROWER RANGE THAN THE UNIVERSE, SUBJECTING ITS ASSETS TO GREATER RISKS OF BUSINESS MODEL CHANGE AND TECHNOLOGICAL OBSOLESCENCE Universe Approved List
PLANT AGE FOR THE APPROVED LIST IS OLDER THAN THE UNIVERSE, REQUIRING GREATER CAPEX TO REMAIN COMPETITIVE Universe Approved List
A MAJORITY OF P/E’s FOR THE APPROVED LIST EXCEED THE UNIVERSE Approved List Universe
PRICE/EQUITY AND ENTERPRISE VALUE TO BOOK MULTIPLES CONFIRM THE TENDENCY FROM THE LCRT DCF ANALYSIS OF THE APPROVED LIST TO APPEAR OVER-VALUED COMPARED TO THE UNIVERSE Universe Universe Approved List Approved List
DILUTED EPS AND CASH FLOW PER SHARE GROWTH RATES Approved List Approved List Universe Universe
THE APPROVED LIST CONTAINS FIRMS WITH A NARROWER RANGE OF GROWTH RATES THAN THE UNIVERSE Approved List Universe Approved List
FIRMS IN THE APPROVED LIST HAVE A MUCH HIGHER PROPORTION OF FOREIGN SALES THAN THE UNIVERSE, MEANING THE APPROVED PORTFOLIO WILL BE MORE SENSITIVE TO CHANGES IN THE DOLLAR’S VALUE With higher CER’s than other countries, the USA will continue to attract capital forcing a stronger dollar over time. (Negative trade flows, so much maligned in the liberal press by people who don’t understand the economics, are the balance to the positive capital flows.) Therefore, the outlook for the Approved list is negative in the short term due to dollar variability and negative in the long term due to likely dollar strength. Universe Approved List
THE APPROVED LIST FAVORS MOSTLY LARGER FIRMS Universe Universe Approved List Approved List
THE APPROVED LIST FACES A SLIGHTLY NARROWER RANGE OF EARNINGS-PRICE RATIOS THAN THE UNIVERSE Approved List Universe
VALUE/COST MULTIPLES CONFIRM THE TENDENCY FROM THE LCRT DCF ANALYSIS OF THE APPROVED LIST TO APPEAR OVER-VALUED COMPARED TO THE UNIVERSE Universe Approved List
PRICE TO CASH FLOW AND SALES MULTIPLES Approved List Universe Universe Approved List Approved List
ENTERPRISE VALUES TO EBITDA AND EBIT RATIOS Approved List Approved List Universe Universe Approved List Approved List
MARKET LEVERAGE FOR THE APPROVED LIST IS LOWER THAN THE UNIVERSE, WHILE BOOK LEVERAGE IS ABOUT THE SAME Universe Approved List Approved List Universe
DIVIDEND PAYOUT RATIO Approved List Universe