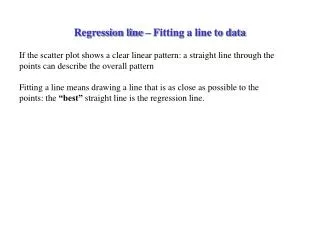
Regression line – Fitting a line to data
Regression line – Fitting a line to data. If the scatter plot shows a clear linear pattern: a straight line through the points can describe the overall pattern Fitting a line means drawing a line that is as close as possible to the points: the “best” straight line is the regression line.

Regression line – Fitting a line to data
E N D
Presentation Transcript
Regression line – Fitting a line to data If the scatter plot shows a clear linear pattern: a straight line through the points can describe the overall pattern Fitting a line means drawing a line that is as close as possible to the points: the “best” straight line is the regression line.
To see how productivity was related to level of maintenance, a firm randomly selected 5 of its high speed machines for an experiment. Each machine was randomly assigned a different level of maintenance X and then had its average number of stoppage Y recorded. These are the data: Correlation coefficient r = 0.94 Simple Example: Productivity level To see how productivity was related to level of maintenance, a firm randomly selected 5 of its high speed machines for an experiment. Each machine was randomly assigned a different level of maintenance X and then had its average number of stoppages Y recorded. 1.8 1.6 1.4 1.2 1.0 0.8 0.6 0.4 0.2 0 r=–0.94 # interruptions | | | | | | | | 2 4 6 8 10 12 14 16 X Hours of maintenance
Least squares regression line Definition The regression line of y on x is the line that makes the sum of the squares of the vertical distances (deviations) of the data points from the line as small as possible Average value of y at x It is defined as Note: b has the same sign of r Slope b = r*sd(y)/sd(x) Intercept a = ave(y) – b*ave(x) We use to distinguish between the values predicted from the regression line and the observed values.
Example: cont. The regression line of the number of interruptions and the hours of maintenance per week is calculated as follows. The descriptive statistics for x and y are: Ave(x)=8 s(x)=3.16; Ave(y)=1 s(y)=0.45 and r=–0.94 Slope Intercepta=ave(y) –b ave(x)=1– (–0.135) 8=2.08 Regression Line: = 2.08 –0.135 x = 2.08 –0.135 hours
1.8 1.6 1.4 1.2 1.0 0.8 0.6 0.4 0.2 0 Point of averages # interruptions residual r=–0.94 | | | | | | | | 2 4 6 8 10 12 14 16 X Hours of maintenance Regression line= 2.08 –0.135 hours If the slope is positive, Y increases linearly with X. The slope value is the increase in Y for an increase of one unit in X. If the slope is negative, Y decreases linearly with X. The slope value is the decrease in Y for an increase of one unit in X The slope is b=-0.135. If you increase the maintenance schedule by one hour, the average number of stoppages will decrease by 0.135.
Residuals For a given x, use the regression line to predict the response The accuracy of the prediction depends on how spread out the observations are around the line. Y Observed value y Error Predicted value x
Example: CPU Usage A study was conducted to examine what factors affect CPU usage. A set of 38 processes written in a programming language was considered. For each program, data were collected on the CPU usage in seconds, and the number of lines (in thousands) of the program. CPU usage The scatter plot shows a clear positive association. We’ll fit a regression line to model the association! Number of lines
Variable N Mean Std Dev Sum Minimum Maximum Y time 38 0.15710 0.13129 5.96980 0.01960 0.46780 X linet 38 3.16195 3.96094 120.15400 0.10200 14.87200 Correlation Coefficient =0.89802 The regression line is
Goodness of fit measures Coefficient of determination • R2 = (correlation coefficient)2 • describes how good the regression line is in explaining the response y. • fraction of the variation in the values of y that is explained by the regression line of y on x. • Varies between 0 and 1. Values close to 1, then the regression line provides a good explanation of the data; close to zero, then the regression line is not able to capture the variability in the data
EXAMPLE (cont.): The correlation coefficient is r = –0.94. The regression line is able to capture 88.3% of the variability in the data. It is computed by the Excel functionRSQ
2. Residuals The vertical distances between the observed points and the regression line can be regarded as the “left-over” variation in the response after fitting the regression line. A residual is the difference between an observed value of the response variable y and the value predicted by the regression line. Residual e = observed y – predicted y = = y – (intercept – slope x) = = y – (a + b x) A special property: the average of the residuals is always zero.
EXAMPLE: Residuals for the regression line = 2.08 – 0.135 x for the number of interruptions Y on the hours of maintenance X.
3. Accuracy of the predictions If the cloud of points is football-shaped, the prediction errors are similar along the regression line. One possible measure of the accuracy of the regression predictions is given by the root mean square error (r.m.s. error). The r.m.s. error is defined as the square root of the average squared residual: This is an estimate of the variation of y about the regression line. It is computed by the Excel function STEYX
1 r.m.s. error Roughly 68% of the points 2 r.m.s. errors Roughly 95% of the points
Computing the r.m.s.error: The r.m.s. error is (0.0911/3) = 0.174 If the company will schedule 7 hours of maintenance per week, the predicted weekly number of interruptions of the machine will be =2.08 – 0.1357=1.135 on average. Using the r.m.s. error, more likely the number of interruptions will be between 1.135–2*0.174=0.787 and 1.135+2*0.174=1.483.
Detect problems in the regression analysis: the residual plots The analysis of the residuals is useful to detect possible problems and anomalies in the regression A residual plot is a scatter plot of the regression residuals against the explanatory variable. Points should be randomly scattered inside a band centered around the horizontal line at zero (the mean of the residuals).
“Good case” Residual X “Bad cases” Variation of y changing with x Non linear relationship
Anomalies in the regression analysis • If the residual plot displays a curve the straight line is not a good description of the association between x and y • If the residual plot is fan-shaped the variation of y is not constant. In the figure above, predictions on y will be less precise as x increases, since y shows a higher variability for higher values of x.
Example of CPU usage data Residual plot Do you see any striking pattern?
Example: 100 meter dash At the 1987 World Championship in Rome, Ben Johnson set a new world record in the 100-meter dash. Scatter plot for Johnson’s times The data: Y=the elapsed time from the start of the race in 10-meter increments for Ben Johnson, X= meters Elapsed time Meters Johnson Average 55 5.83 St. dev. 30.27 2.52 Correlation = 0.999 Meters
Regression Line Elapsed time Meters The fitted regression line is =1.11+0.09 meters. The value of R2 is 0.999, therefore 99.9% of the variability in the data is explained by the regression line.
Residual Plot Residual Meters Does the graph show any anomaly?
Outliers and Influential points An outlier is an observation that lies outside the overall pattern of the other observation Large residual outlier
Influential Point An observation is influential for the regression line, if removing it would change considerably the fitted line. An influential point pulls the regression line towards itself. Regression line if is omitted Influential point
Example: house prices in Albuquerque. =365.66+0.5488 price. The coefficient of determination is R2=0.4274. Annual tax What does the value of R2 say? Selling price Are there any influential points?
New analysis: omitting the influential points Previous regression line The regression line is =-55.364+0.8483 price The coefficient of determination is R2=0.8273 Annual tax Selling price The new regression line explains 82% of the variation in y .
Summary – Warnings • Correlation measures linear association, regression line should be used only when the association is linear • Extrapolation – do not use the regression line to predict values outside the observed range – predictions are not reliable • Correlation and regression line are sensitive to influential / extreme points • Check residual plots to detect anomalies and “hidden” patterns which are not captured by the regression line