Download

1 / 17
170 likes | 375 Vues
Solving Linear Inequalities and Systems of Inequalities. MCC9-12.A.REI.12. Introduction. Solving and graphing linear inequalities are almost the same as solving and graphing linear equations. There are only a few key differences. Key Concepts.

E N D
Solving Linear Inequalities and Systems of Inequalities MCC9-12.A.REI.12
Introduction • Solving and graphing linear inequalities are almost the same as solving and graphing linear equations. There are only a few key differences.
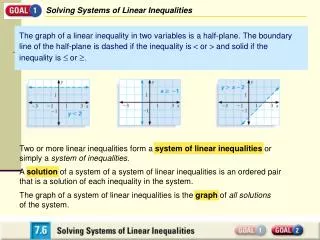
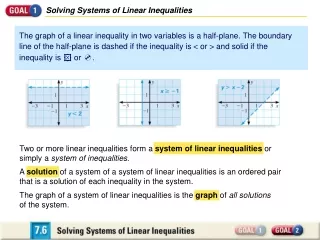
Key Concepts • A linear inequality in two variables has a half plane as the set of solutions. • A half plane is a region containing all points that has one boundary, which is a straight line that continues in both directions infinitely. • To determine the solution set, graph the inequality first. Remember to put your inequality into slope-intercept form!
Key Concepts • When graphing, sometimes the boundary is part of the solution. This occurs when you see the symbols or . This means inclusive. We represent this with a solid line when graphing. • Other times, the boundary is not part of the solution. This occurs when you see the symbols < or >. This means non-inclusive. We represent this with a dashed line when graphing.
Key Concepts • Either all of the points above the line or all the points below the line will be part of the solution. • To find out which side of the line contains the solutions, choose a point that is clearly on one side of the line or the other. • Substitute the test point into the inequality.
Key Concepts - Shading • If the test point makes the inequality true, shade the half plane that contains the test point. • If the test point does not make the inequality true, shade the other half plane.
Example 1 First, plot your y-intercept. Then, use your slope to determine more points. Now, graph your line. • Graph the solutions to the inequality:
Example 1 To determine where to shade, choose a convenient test point. (0, 0) is usually a great pick! • Graph the solutions to the inequality:
Example 1 When we substitute, we get 0 > 3. Since this is false, we will NOT shade this half plane. Instead, we must shade the other half plane. • Graph the solutions to the inequality:
Example 2 • Richmond Hill High School needs to hire a few more teachers. There are 14 positions available, and they are currently only hiring English and Math teachers. Write and graph an inequality that represents the number of new Math and English teachers who can be hired.
First, create an inequality from the context. • Next, graph this inequality. It may be easy to use the x-intercept and y-intercept for this. Does your graph require a solid or dashed line? Should the line continue on forever?
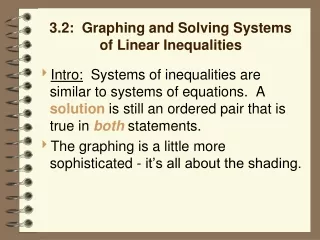
Solving Systems of Linear Inequalities • Graphing systems of inequalities is simply graphing more than one inequality on the same set of axes. However, determining the solution is slightly different.
Key Concepts • To solve a system of linear inequalities, graph each inequality and shade correctly. • Look for the area where the shading overlaps. This is the solution. In other words, the solution is the part of the graph that has been shaded more than once. • Remember to add logical constraints. For example, items and people cannot have negative values!
Example 3 To begin, graph only one of the inequalities at a time. Start with x + y > 10. Then, shade appropriately. • Solve the system of inequalities:
Example 3 Next, graph the second equation, 2x – 4y > 5. Again, shade appropriately. Notice where the shading overlaps. This region is the solution set for this system. • Solve the system of inequalities:
Example 3 Name a point that could be a solution to this system. How can you tell by using the graph? How could you tell by using the system of inequalities? • Solve the system of inequalities: